Login to Ask a Question or Reply
You must be logged in to post your query.
Home › Forums › Feature Requests & Feedback › Creating Multi Series Chart in AJAX with JSON
Creating Multi Series Chart in AJAX with JSON
- This topic has 13 replies, 2 voices, and was last updated 7 years, 9 months ago by
yansonalvin97.
Tagged: MultiSeriesChart AJAX JSON
-
May 3, 2018 at 8:24 am #20538
Hi canvasjs developers.
Please can you help me generate a multi series chart in ajax based on JSON. I already know how to generate a single series chart in ajax with json but Im having a hard time for multi series chart.
Please please help me I hope you will answer. Please man.
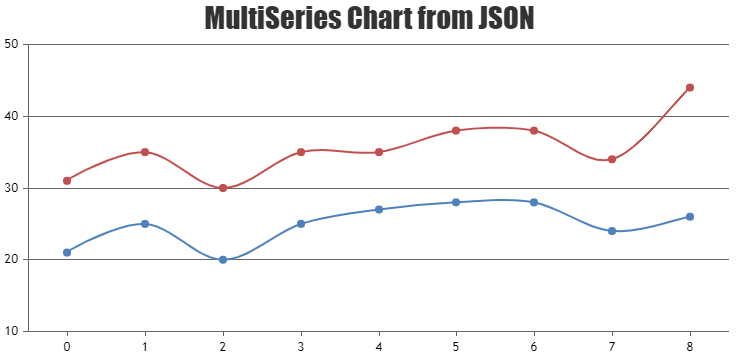
May 3, 2018 at 10:27 am #20545Please refer this documentation page for step-to-step tutorial on rendering chart with data from JSON. Adding another dataseries should let you create multi-series chart. Please find the code-snippet below.
$.getJSON("https://api.npoint.io/bad5c5a9b3669e0ff3ee", function(data) {
for(var i = 0; i < data.length; i++) {
    dps1.push({ label: data[i].label, y: data[i].y1 });
    dps2.push({ label: data[i].label, y: data[i].y2 });
  }
});
Please take a look at this JSFiddle for complete code.

—
Vishwas R
Team CanvasJSMay 3, 2018 at 11:19 am #20547Thanks man. Nice solution. Keep it up. I will just tell you if mine works…
One more question, is it possible to switch from multi series chart like stackedBar, stackedColumn graph to pie graph or doughnut graph?-
This reply was modified 7 years, 9 months ago by
yansonalvin97.
-
This reply was modified 7 years, 9 months ago by
yansonalvin97.
May 3, 2018 at 12:18 pm #20555Works fine. But I still have a concern.
Please refer to the provided link of image Graph
The data of this graph comes from a json and I dont want to have a duplicate in the year. Can you please tell me whats going on? Thank you. This is my json
JSON-
This reply was modified 7 years, 9 months ago by
yansonalvin97.
May 3, 2018 at 1:13 pm #20565One more question, is it possible to switch from multi series chart like stackedBar, stackedColumn graph to pie graph or doughnut graph?
Pie/Doughnut charts doesn’t support multi-series as of now. However switching between stackedBar/stackedColumn to pie/doughnut works fine where chart accepts and renders only first dataSeries.
The data of this graph comes from a json and I dont want to have a duplicate in the year. Can you please tell me whats going on? Thank you. This is my json
Can you kindly create jsfiddle with sample data, so that we can understand it better and help you out?
—
Vishwas R
Team CanvasJSMay 3, 2018 at 2:00 pm #20569Here is my jsfiddle Now its not working online but in my laptop it works and it renders. please help
May 3, 2018 at 3:27 pm #20573You can update the chart data by changing options and calling
chart.render();. Please refer to this documentation page for step-to-step tutorial on the same.

in your case, you need to group the datapoints from JSON based on year. Please take a look at this updated JSFiddle.Also, we suggest you to initialize chart once before AJAX rather than initializing it on every AJAX calls.
—
Vishwas R
Team CanvasJSMay 3, 2018 at 6:18 pm #20579Wish I have a talent like your’s. Works like a gem. Thank you very much Vishwas R.
May 4, 2018 at 6:09 am #20584Hi Vishwas, is it possible to have another dropdown in order to filter the courses based on the college or department? I wish to have another dropdown next to the chart type which you have provided me yesterday. Here is my jsfiddle. Thank you very much Vishwas.
May 4, 2018 at 10:50 am #20591You can modify and customize chart-options dynamically. Adding another dropdown to filter based on department/course should work fine if you handle chart-options accordingly. Below is the code snippet for the same.
var courseName = document.getElementById('courseName');
courseName.addEventListener( "change",  function(){
		var dataSeries;
    for(var i= 0; i < data.length; i++){
        if(data[i].name === courseName.options[courseName.selectedIndex].value){
        			dataSeries = data[i];
              dataSeries.type = selectedChartType;
              chart.options.data = [];
              chart.options.data.push(dataSeries);
        }
        else if(courseName.options[courseName.selectedIndex].value === ""){
        		for(var i = 0; i < data.length; i++){
            		data[i].type = selectedChartType;
            }
    				chart.options.data = data;
        }
    }

    chart.render();
});
Please take a look at this updated jsfiddle.
—
Vishwas R
Team CanvasJSMay 4, 2018 at 11:28 am #20593Thank you again Vishwas R
May 4, 2018 at 12:20 pm #20596Hi again Vishwas. Did you see my JSON file ? Instead of the courses in the drop down list how can I replace it with the college field? In my JSON it consist of two college which is the CIT and COE. I want CIT and COE as the drop down values. Thank you again.
May 7, 2018 at 10:22 am #20615You can add dropdown to either course or college or based on both and updating the chart options according to the drop-down option that has been selected will work fine. Please find the code-snippet below.
var data = chart.options.data;
var selectedChartType = 'stackedColumn';
var chartType = document.getElementById('chartType');
chartType.addEventListener( "change",  function(){
  selectedChartType = chartType.options[chartType.selectedIndex].value;
  for(var i= 0; i < chart.options.data.length; i++){
    chart.options.data[i].type = chartType.options[chartType.selectedIndex].value;
  }
  chart.render();
});

var college = document.getElementById('college');
college.addEventListener( "change",  function(){
  var dataSeries;
  chart.options.data = [];
  for(var i= 0; i < data.length; i++){
    if(data[i].college === college.options[college.selectedIndex].value){
      dataSeries = data[i];
      dataSeries.type = selectedChartType;

      chart.options.data.push(dataSeries);
    }
    else if(college.options[college.selectedIndex].value === ""){
      for(var i = 0; i < data.length; i++){
        data[i].type = selectedChartType;
      }
      chart.options.data = data;
    }
  }

  chart.render();
});
Please take a look at this updated JSFiddle for complete code.
—
Vishwas R
Team CanvasJSMay 7, 2018 at 11:27 am #20617Thank you again. It works..
-
This reply was modified 7 years, 9 months ago by
Tagged: MultiSeriesChart AJAX JSON
You must be logged in to reply to this topic.