Home Forums Chart Support Color patterns on bar range chart

Color patterns on bar range chart

Viewing 2 posts - 1 through 2 (of 2 total)
  • #36473

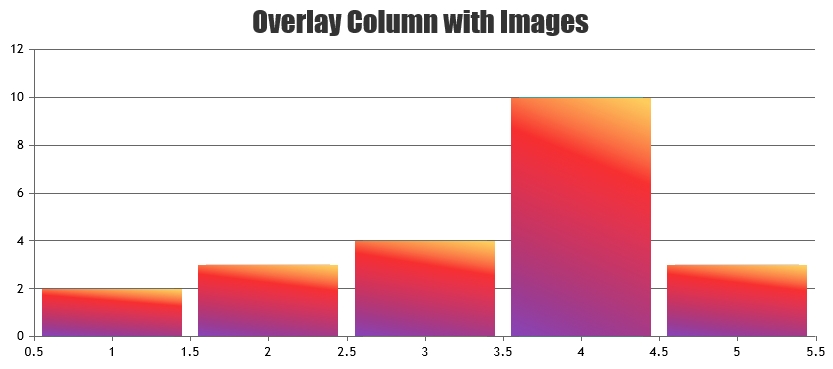
    Hey there, thank you so much of this amazing library, My question here is how to add strips pattern on an individual bar or how to add an image inside the bar/ column.
    Basically how do I change the appearance of the bar/column other than changing the color only

    #36476

    @minaisaac1994,

    It is possible to position image over column/bar chart with the help of convertValueToPixel method. Please take a look at this JSFiddle for working example.

    positioning-image-on-top-of-chart

    Also, kindly check this documentation page for step-to-step tutorial on positioning image on top of chart.


    Ranjitha R
    Team CanvasJS

Viewing 2 posts - 1 through 2 (of 2 total)

You must be logged in to reply to this topic.