@imi-khan,
CanvasJS Chart automatically sets the width and height of the chart according to container’s dimensions. When the container’s dimension is not specified it takes up the default width & height(500px X 400px).
You would have to set 100% width for the Chart Container.
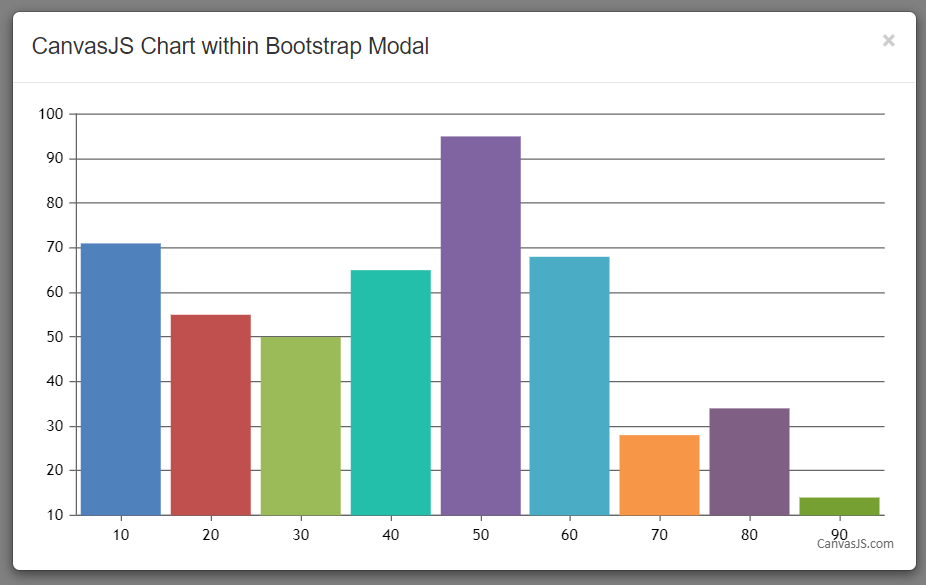
Also, in bootstrap, since the modal is not displayed initially, chart takes the default values. To solve this issue, you can render the chart when the shown.bs.modal event is fired.
$('#chartModal').on('shown.bs.modal', function () {
        chart.render();
});
Please take a look at this JSFiddle.

___________
Indranil Deo
Team CanvasJS
