@suhaspatil,
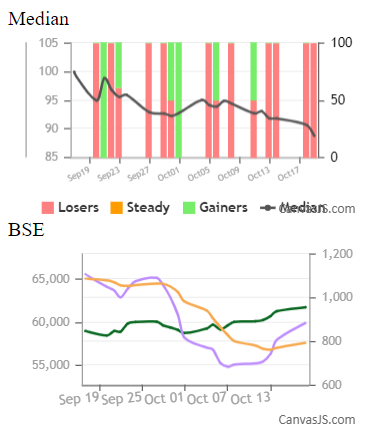
Based on the sample shared by you, the issue doesn’t seem to be related to memory consumption, instead, it looks like the date-time is not passed in a standard format because of which the charts are not rendering across all browsers. Passing the date-time in a standard format with timezone as shown below should work fine in your case –
nopointsarr.push({x:new Date(allTrend[c].replace(/-/g, "/") + " GMT+0500"), y:noportarr[c]});
Please take a look at this JSFiddle for a working example.

___________
Indranil Deo
Team CanvasJS
