Login to Ask a Question or Reply
You must be logged in to post your query.
Home › Forums › Chart Support › Canvas.js working in localhost but not working after upload to the Server
Canvas.js working in localhost but not working after upload to the Server
- This topic has 3 replies, 2 voices, and was last updated 6 years, 10 months ago by
Vishwas R.
Tagged: codeignitor, mysql, php
-
May 26, 2019 at 6:51 pm #25301
canvas JS $(function () { / */ var areaChartData = { labels : ['January', 'February', 'March', 'April', 'May', 'June', 'July', 'August', 'September', 'October', 'November', 'December'], datasets: [ { label : 'Electronics', fillColor : 'rgba(210, 214, 222, 1)', strokeColor : 'rgba(210, 214, 222, 1)', pointColor : 'rgba(210, 214, 222, 1)', pointStrokeColor : '#c1c7d1', pointHighlightFill : '#fff', pointHighlightStroke: 'rgba(220,220,220,1)', data : report_data } ] }/------------- //- BAR CHART - //------------- var barChartCanvas = $('#barChart').get(0).getContext('2d') var barChart = new Chart(barChartCanvas) var barChartData = areaChartData barChartData.datasets[0].fillColor = '#00a65a'; barChartData.datasets[0].strokeColor = '#00a65a'; barChartData.datasets[0].pointColor = '#00a65a'; var barChartOptions = { //Boolean - Whether the scale should start at zero, or an order of magnitude down from the lowest value scaleBeginAtZero : true, //Boolean - Whether grid lines are shown across the chart scaleShowGridLines : true, //String - Colour of the grid lines scaleGridLineColor : 'rgba(0,0,0,.05)', //Number - Width of the grid lines scaleGridLineWidth : 1, //Boolean - Whether to show horizontal lines (except X axis) scaleShowHorizontalLines: true, //Boolean - Whether to show vertical lines (except Y axis) scaleShowVerticalLines : true, //Boolean - If there is a stroke on each bar barShowStroke : true, //Number - Pixel width of the bar stroke barStrokeWidth : 2, //Number - Spacing between each of the X value sets barValueSpacing : 5, //Number - Spacing between data sets within X values barDatasetSpacing : 1, //String - A legend template legendTemplate : '<ul class="<%=name.toLowerCase()%>-legend"><% for (var i=0; i<datasets.length; i++){%><li><span style="background-color:<%=datasets[i].fillColor%>"></span><%if(datasets[i].label){%><%=datasets[i].label%><%}%></li><%}%></ul>', //Boolean - whether to make the chart responsive responsive : true, maintainAspectRatio : true } barChartOptions.datasetFill = false barChart.Bar(barChartData, barChartOptions) }) </script><div class="box"> <div class="box-header"> <h3 class="box-title">Total Paid Orders - Report</h3> </div> <!-- /.box-header --> <div class="box-body"> <div class="chart"> <canvas id="barChart" style="height:250px"></canvas> </div> </div> <!-- /.box-body --> </div> <!-- /.box --> <div class="box"> <div class="box-header"> <h3 class="box-title">Total Paid Orders - Report Data</h3> </div> <!-- /.box-header --> <div class="box-body"> <table id="datatables" class="table table-bordered table-striped"> <thead> <tr> <th>Month - Year</th> <th>Amount</th> </tr> </thead> <tbody> <?php foreach ($results as $k => $v): ?> <tr> <td><?php echo $k; ?></td> <td><?php echo $company_currency .' ' . $v; //echo $v; ?></td> </tr> <?php endforeach ?>-
This topic was modified 6 years, 10 months ago by
santoshbaruah.
May 26, 2019 at 6:56 pm #25303Canvas JS $(function () { /* Canvas JS * ------- * Here we will create a few charts using Canvas JS */ var areaChartData = { labels : ['January', 'February', 'March', 'April', 'May', 'June', 'July', 'August', 'September', 'October', 'November', 'December'], datasets: [ { label : 'Electronics', fillColor : 'rgba(210, 214, 222, 1)', strokeColor : 'rgba(210, 214, 222, 1)', pointColor : 'rgba(210, 214, 222, 1)', pointStrokeColor : '#c1c7d1', pointHighlightFill : '#fff', pointHighlightStroke: 'rgba(220,220,220,1)', data : report_data } ] }//------------- //- BAR CHART - //------------- var barChartCanvas = $('#barChart').get(0).getContext('2d') var barChart = new Chart(barChartCanvas) var barChartData = areaChartData barChartData.datasets[0].fillColor = '#00a65a'; barChartData.datasets[0].strokeColor = '#00a65a'; barChartData.datasets[0].pointColor = '#00a65a'; var barChartOptions = { //Boolean - Whether the scale should start at zero, or an order of magnitude down from the lowest value scaleBeginAtZero : true, //Boolean - Whether grid lines are shown across the chart scaleShowGridLines : true, //String - Colour of the grid lines scaleGridLineColor : 'rgba(0,0,0,.05)', //Number - Width of the grid lines scaleGridLineWidth : 1, //Boolean - Whether to show horizontal lines (except X axis) scaleShowHorizontalLines: true, //Boolean - Whether to show vertical lines (except Y axis) scaleShowVerticalLines : true, //Boolean - If there is a stroke on each bar barShowStroke : true, //Number - Pixel width of the bar stroke barStrokeWidth : 2, //Number - Spacing between each of the X value sets barValueSpacing : 5, //Number - Spacing between data sets within X values barDatasetSpacing : 1, //String - A legend template legendTemplate : '<ul class="<%=name.toLowerCase()%>-legend"><% for (var i=0; i<datasets.length; i++){%><li><span style="background-color:<%=datasets[i].fillColor%>"></span><%if(datasets[i].label){%><%=datasets[i].label%><%}%></li><%}%></ul>', //Boolean - whether to make the chart responsive responsive : true, maintainAspectRatio : true } barChartOptions.datasetFill = false barChart.Bar(barChartData, barChartOptions) }) </script>some html <div class="box"> <div class="box-header"> <h3 class="box-title">Total Paid Orders - Report</h3> </div> <!-- /.box-header --> <div class="box-body"> <div class="chart"> <canvas id="barChart" style="height:250px"></canvas> </div> </div> <!-- /.box-body --> </div> <!-- /.box --> <div class="box"> <div class="box-header"> <h3 class="box-title">Total Paid Orders - Report Data</h3> </div> <!-- /.box-header --> <div class="box-body"> <table id="datatables" class="table table-bordered table-striped"> <thead> <tr> <th>Month - Year</th> <th>Amount</th> </tr> </thead> <tbody> <?php foreach ($results as $k => $v): ?> <tr> <td><?php echo $k; ?></td> <td><?php echo $company_currency .' ' . $v; //echo $v; ?></td> </tr> <?php endforeach ?>May 26, 2019 at 6:57 pm #25304already try this but not working
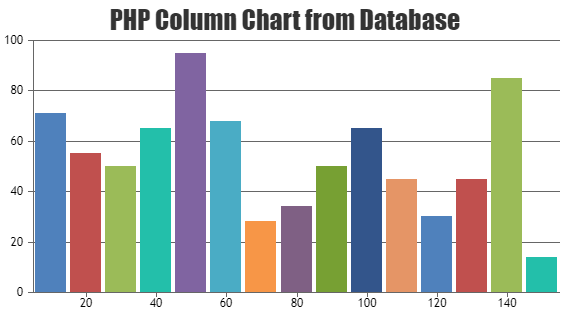
window.onload = function () {
    setTimeout(function () {
        var ctx = document.getElementById("valueChart").getContext("2d");
        window.myLine = new Chart(ctx).Line(lineChartData, {
            responsive: true
        });
    }, 1000);

}
May 27, 2019 at 4:17 pm #25305Please take a look at the gallery example on rendering chart in PHP with data from database. You can also download sample project from our download page to run it locally.
If this doesn’t help you fulfill your requirements or finding any difficulty in integrating CanvasJS in your PHP page, kindly share sample project along with sample database over Google-Drive or Onedrive so that we can run it locally at our end, understand the issue you are facing and help you out.
—
Vishwas R
Team CanvasJS -
This topic was modified 6 years, 10 months ago by
Tagged: codeignitor, mysql, php
You must be logged in to reply to this topic.