Login to Ask a Question or Reply
You must be logged in to post your query.
Home › Forums › Chart Support › Canvas will not work for me
Canvas will not work for me
- This topic has 3 replies, 3 voices, and was last updated 10 years, 9 months ago by
Anjali.
Tagged: Doesn't display
-
May 8, 2015 at 3:01 am #8702
<!DOCTYPE HTML>
<html>

<head>
    <script type="text/javascript" src="../scripts/jquery.canvasjs.min.js"></script>
    <script type="text/javascript" src="../scripts/canvasjs.min.js"></script>
    <script type="text/javascript" src="../scripts/jquery-2.1.3.js"></script>
    <script type="text/javascript" src="../scripts/jquery-2.1.3.min.js"></script>
    <script type="text/javascript" src="../CustomScripts.js"></script>
</head>
<body>
<div id="chartContainer" style="height: 300px; width: 100%;"></div>
</body>

</html>

<?php
$bips=odbc_connect('CONN','NAME','PASSWORD',SQL_CUR_USE_ODBC);
?>

<?php
$data_points= array();

$sql=  "WITH MYTAB1 AS(
        SELECT  ITEM_NBR, LOCATION ,ITEM_DATE
        FROM IEGAR.KPI_FOREMAN_HIST
        WHERE ITEM_NBR=1100
        AND LOCATION='CHIIL'
        ORDER BY 3 DESC
        FETCH FIRST 13 ROWS ONLY
        )

        SELECT H.ITEM_NBR, H.ITEM_DATE, H.LOCATION
        , H.ITEM_VALUE, H.KPI_COMMENT, H.CALC_DEF
        FROM IEGAR.KPI_FOREMAN_HIST H
        INNER JOIN MYTAB1 M ON H.ITEM_NBR=M.ITEM_NBR
        AND H.LOCATION =M.LOCATION
        AND H.ITEM_DATE=M.ITEM_DATE
        order by 2
        WITH UR";

        $Content=odbc_exec($bips,$sql);


    //ITEM_DATE,ITEM_VALUE...?=LOCATION
          while($row= odbc_fetch_array($Content))
        {
            if($row['ITEM_DATE'] != null){
            //echo  $row['ITEM_DATE'];
            //echo  $row['ITEM_VALUE'];
            $point = array("label" => $row['ITEM_DATE'], "y" => $row['ITEM_VALUE']);
            array_push($data_points, $point);
          }
            else
            {
            	$point = array("label" => "ITEM_NBR", "y" => 0);
                array_push($data_points, $point);
            }

          }
            echo json_encode($data_points, JSON_NUMERIC_CHECK);


odbc_close($bips);
?>
JavaScript
$(document).ready(function () { $.getJSON("data.php", function (Content) { chart.options.data[0].dataPoints = Content; var chart = new CanvasJS.Chart("chartContainer", { data: [ { dataPoints: Content } ], legend: { cursor: "pointer", itemclick: function (e) { if (typeof (e.dataSeries.visible) === "undefined" || e.dataSeries.visible) { e.dataSeries.visible = false; } else { e.dataSeries.visible = true; } chart.render(); } } }); chart.render(); }); });May 8, 2015 at 3:17 pm #8705Clow,
Please checkout this example that we have created for rendering the chart using data from MySQL in PHP.
—
Sunil UrsMay 8, 2015 at 6:47 pm #8708<?php $data_points= array(); $result= "WITH MYTAB1 AS( SELECT ITEM_NBR, LOCATION ,ITEM_DATE FROM IEGAR.KPI_FOREMAN_HIST WHERE ITEM_NBR=1100 AND LOCATION='CHIIL' ORDER BY 3 DESC FETCH FIRST 13 ROWS ONLY ) SELECT H.ITEM_NBR, H.ITEM_DATE, H.LOCATION , H.ITEM_VALUE, H.KPI_COMMENT, H.CALC_DEF FROM IEGAR.KPI_FOREMAN_HIST H INNER JOIN MYTAB1 M ON H.ITEM_NBR=M.ITEM_NBR AND H.LOCATION =M.LOCATION AND H.ITEM_DATE=M.ITEM_DATE order by 2 WITH UR"; $result=odbc_exec($bips, $result); //ITEM_DATE,ITEM_VALUE...?=LOCATION while($row= odbc_fetch_array($result)) { if($row['ITEM_DATE'] != null){ //echo $row['ITEM_DATE']; //echo $row['ITEM_VALUE']; $point = array("label" => $row['ITEM_DATE'], "y" => $row['ITEM_VALUE']); array_push($data_points, $point); } else { $point = array("label" => "ITEM_NBR", "y" => 0); array_push($data_points, $point); } } echo json_encode($data_points, JSON_NUMERIC_CHECK); odbc_close($bips); ?>These are my changes but I still cant get it to display
window.onload = function () {
    var dps = [];
    //$(document).ready(function () {
    $.getJSON("data.php", function (result) {

        chart.options.data[0].dataPoints = result;
        var chart = new CanvasJS.Chart("chartContainer", {
            //axisX: {
            //    title: "Weeks",
            //    interval: 7,
            //    intervalType: "day"
            //},
            axisY:{
                title:"Percentage",
            },
            data: [
                {
                    type: "spline",
                    dataPoints: result[
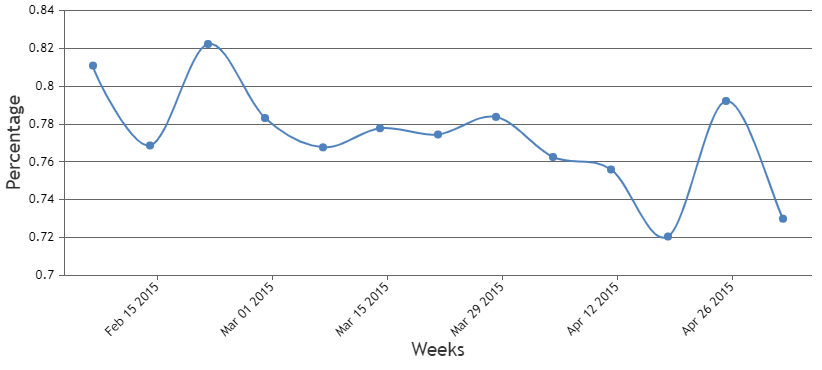
                        { "label": "2015-02-07", "y": 0.8109 },
                        { "label": "2015-02-14", "y": 0.7687 },
                        { "label": "2015-02-21", "y": 0.8223 },
                        { "label": "2015-02-28", "y": 0.7832 },
                        { "label": "2015-03-07", "y": 0.7677 },
                        { "label": "2015-03-14", "y": 0.7778 },
                        { "label": "2015-03-21", "y": 0.7745 },
                        { "label": "2015-03-28", "y": 0.7838 },
                        { "label": "2015-04-04", "y": 0.7626 },
                        { "label": "2015-04-11", "y": 0.756 },
                        { "label": "2015-04-18", "y": 0.7206 },
                        { "label": "2015-04-25", "y": 0.7922 },
                        { "label": "2015-05-02", "y": 0.73 }]
                }
            ],
            legend: {
                cursor: "pointer",
                itemclick: function (e) {
                    if (typeof (e.dataSeries.visible) === "undefined" || e.dataSeries.visible) {
                        e.dataSeries.visible = false;
                    } else {
                        e.dataSeries.visible = true;
                    }
                    chart.render();
                }
            }
        });
        chart.render();
    });
};
This is my read out
[{“label”:”2015-02-07″,”y”:0.8109},{“label”:”2015-02-14″,”y”:0.7687},{“label”:”2015-02-21″,”y”:0.8223},{“label”:”2015-02-28″,”y”:0.7832},{“label”:”2015-03-07″,”y”:0.7677},{“label”:”2015-03-14″,”y”:0.7778},{“label”:”2015-03-21″,”y”:0.7745},{“label”:”2015-03-28″,”y”:0.7838},{“label”:”2015-04-04″,”y”:0.7626},{“label”:”2015-04-11″,”y”:0.756},{“label”:”2015-04-18″,”y”:0.7206},{“label”:”2015-04-25″,”y”:0.7922},{“label”:”2015-05-02″,”y”:0.73}]
-
This reply was modified 10 years, 9 months ago by
CLOW.
May 11, 2015 at 6:30 pm #8711Clow,
After looking into your code we have come across few issues in your code which are mentioned below :
1) Before creating a chart object you are trying to assign result to it’s options
chart.options.data[0].dataPoints = result;Which will throw an error “Uncaught TypeError: Cannot read property ‘options’ of undefined”.2) Before making an AJAX request you are not including jQuery file which will throw an error “Uncaught ReferenceError: $ is not defined”.
3) The way you are assigning result as well hard coded data to dataPoints is syntactically wrong
Please refer to the below code with issue fixed:
<!DOCTYPE html>
<html>
<head>
<title></title>
<script src="https://canvasjs.com/assets/script/jquery-1.11.1.min.js"></script>
<script src="https://cdn.canvasjs.com/canvasjs.min.js"></script>
<script>
window.onload = function () {
	$.getJSON("data.php", function (result) {
		var chart = new CanvasJS.Chart("chartContainer", {
			axisX: {
				title: "Weeks",
				//interval: 1,
				//intervalType: "day",
				labelAngle: -45
			},
			axisY: {
				title: "Percentage",
			},
			data: [
			{
				type: "spline",
				dataPoints: result
			}
			],
			legend: {
				cursor: "pointer",
				itemclick: function (e) {
					if (typeof (e.dataSeries.visible) === "undefined" || e.dataSeries.visible) {
						e.dataSeries.visible = false;
					} else {
						e.dataSeries.visible = true;
					}
					chart.render();
				}
			}
		});
		chart.render();
	});
}
</script>
</head>
<body>
	<div id="chartContainer" style="width: 50%; height: 300px"></div>
</body>
</html>
__
Anjali -
This reply was modified 10 years, 9 months ago by
Tagged: Doesn't display
You must be logged in to reply to this topic.