@tuelle42,
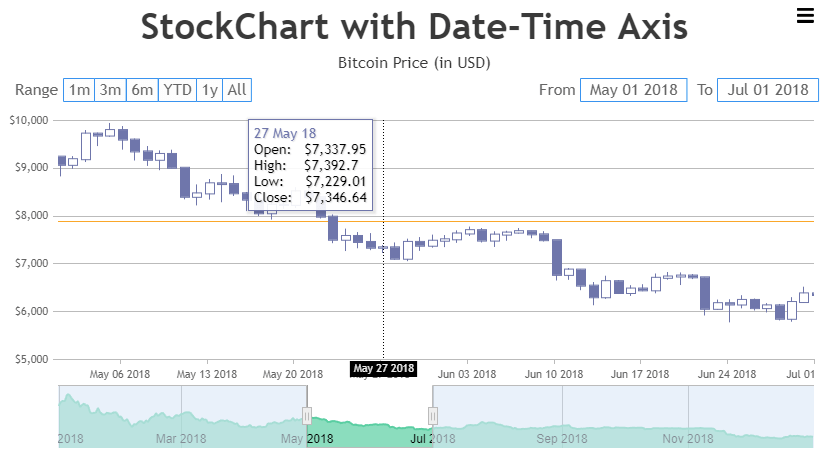
You can get to know y-value of the clicked position anywhere on the chart by converting the pixel coordinates of the event to y-value using convertPixelToValue method as shown in the code snippet below.
$(stockChart.charts[0].container).on("mousedown", function(e) {
    var offset = $(this).offset();
    var relY = e.pageY - offset.top;

    stockChart.charts[0].axisY[0].addTo("stripLines", {
      value: stockChart.charts[0].axisY[0].convertPixelToValue(relY)
    });
 });
Kindly take a look at this JSFiddle for adding a stripline to y-value corresponding to the event coordinate.

__
Sachin Bisht
Team CanvasJS
