@harishv,
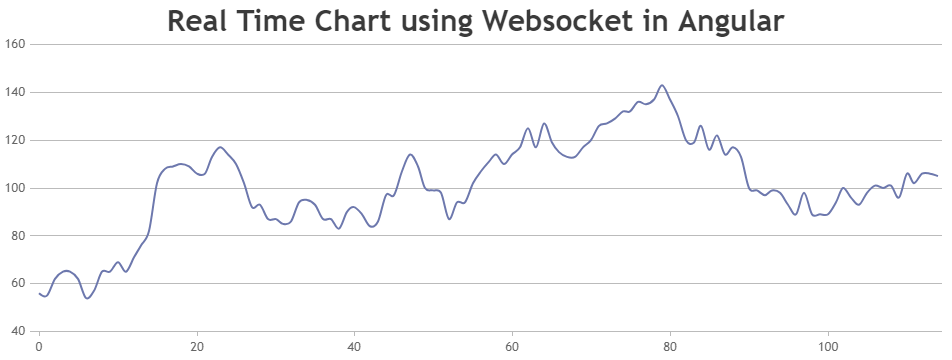
You can create a websocket service in Angular app which establishes connection with your C-program and receives data. The received data should be parsed to the format accepted by CanvasJS to update the chart. Please check the code-snippet below that shows how to parse the data received from the websocket.
.
ngOnInit(): void {
  this.websocketService.connect();
  this.websocketService.messageReceived.subscribe((message: string) => {
    // message passed from the socket is in format { "value": 10 }. Parse to dataPoint format as per value returned from the socket service.
    let data = JSON.parse(message);
    this.dataPoints.push({
      y: data.value
    });
    this.chart.render();
  })
}
.
You can download the working sample from here. Also, refer to this article for more information on creating websocket service in Angular.

—-
Manoj Mohan
Team CanvasJS