@dpokeda,
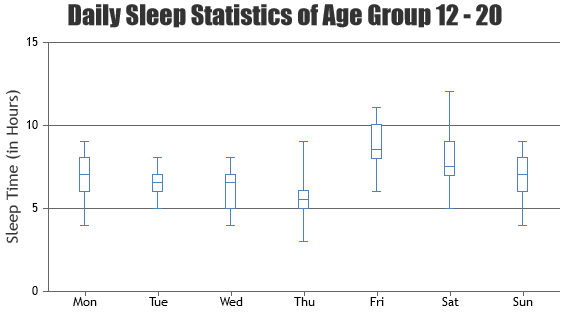
Box & Whisker Charts accept y-value as an array of 5 values [Minimum, Quartile-1, Quartile-2, Quartile-3, Maximum], where quartile 2 can be mean or median as per your requirements. Passing array of 5 values as datapoint y-value seems to be working fine.

If your facing some other issue, kindly create JSFiddle reproducing the issue you are facing and share it with us so that we can look into the chart-options being used, understand the scenario better and help you resolve.
—
Vishwas R
Team CanvasJS
