@sravya,
By default, Chart takes the size of its container(if set). So you can just set the width and height of the chart-container in which you are rendering the chart as shown below:
<div id="chartContainer" style="height: 300px; width: 100%;">
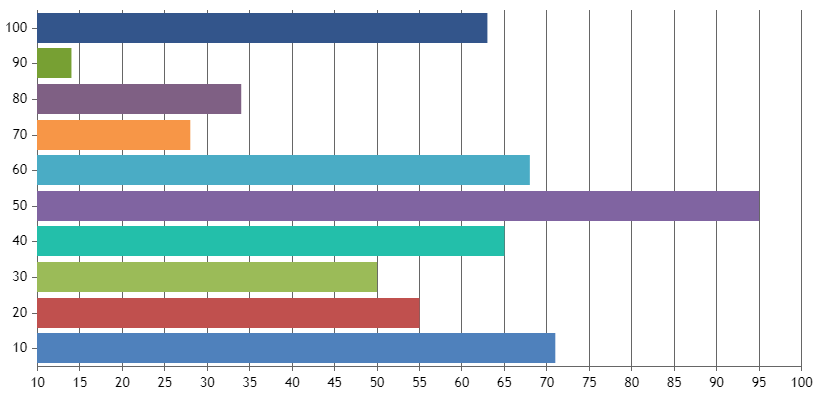
If you like to change the height of the chart keeping the dataPointWidth as constant, you can update the height of chart as shown in the below code snippet.
function handleChartHeight(chart){
    var dpsWidth = 30;
    var plotAreaHeight = chart.axisX[0].bounds.height;
    var chartHeight = plotAreaHeight + (2.5 * dpsWidth);
    chart.options.dataPointWidth = dpsWidth;
    chart.options.height = chartHeight;
}
Please take a look at this JSFiddle for complete code.

__
Priyanka M S
Team CanvasJS
