@net-peretzgmail-com,
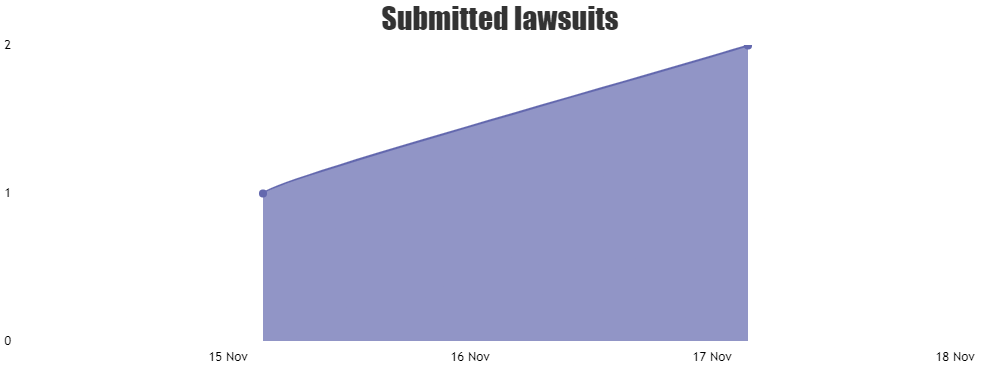
As you are passing x-values as time-stamp, it’s not considered as date-time but number. Setting interval to 1 will make chart render axis label at an interval of 1, i.e. for every 1 milliseconds and not at every 1 day. Setting xValueType: "dateTime" will convert axis into date-time axis & should work fine in this case. Also, I would suggest you to use valueFormatString to define the format of the axis label instead of using labelFormatter, unless your requirement is to completely format the axis label. Please take a look at this updated JSFiddle for the working code.

—
Vishwas R
Team CanvasJS
