@franklopez,
Accessibility for individual dataPoints using “Tab” key is not available as of now. However, you can provide a chart-description for a chart container by adding aria-label and tabindex, which can be read using the screen reader like windows narrator when the focus is kept on the chart. Please check the below code snippet for adding aria-label and tabindex –
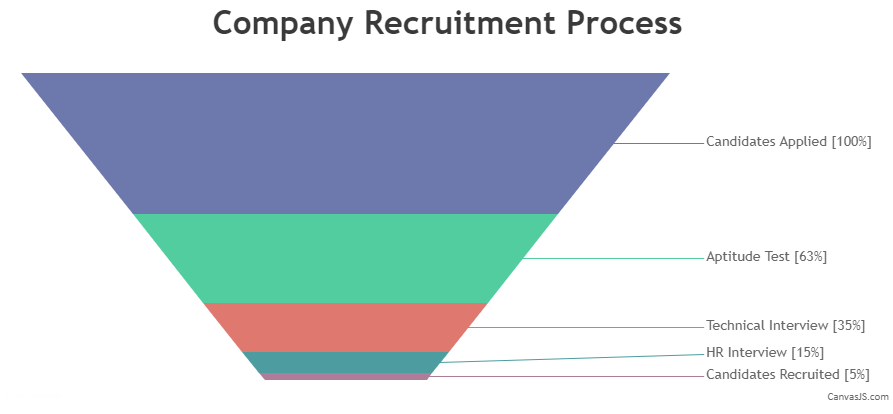
var chartDescription = "A Funnel  Chart showing Company Recruitment Process where in which 63 percent of candidates cleared the aptitude test, 35 percent cleared the technical interview, 15 precent went through the HR interview and out of which 5 percent candidates were recruited";

chart.container.setAttribute("aria-label", chartDescription);
chart.container.setAttribute("tabindex", "0");
Also, kindly check this StackBlitz for an example on same.

___________
Adithya Menon
Team CanvasJS
