Login to Ask a Question or Reply
Home › Forums › Chart Support › Multiple charts from one JSON result › Reply To: Multiple charts from one JSON result
March 2, 2015 at 3:35 pm
#8279
[Update]
Now we have a Tutorial on Creating Charts from JSON Data in our documentation.
willibald,
After getting Json result, create a HTML page that does AJAX request and fetch the data. After getting the data, it will render a Chart.
Below is the sample code:
<html>
<head>
<script type="text/javascript" src="https://canvasjs.com/assets/script/jquery-1.11.1.min.js"></script>
<script type="text/javascript" src="https://cdn.canvasjs.com/canvasjs.min.js"></script>
<script type="text/javascript">
 $(document).ready(function () {

	var dataPointsTemp = [];
	var dataPointsHumidity = [];

// Ajax request for getting JSON data

	$.getJSON("data.json", function(data) {
		for( var i = 0; i < data.length; i++) {
			dataPointsTemp.push({ label: data[i].label, y: data[i].y });
			dataPointsHumidity.push({ label: data[i].label, y: data[i].y2 });
		}

		// Chart with label + y values

		var chart = new CanvasJS.Chart("chartContainer1",
		{
			title:{
				text: "Chart with y value"
			},
			data: [
			{
				dataPoints: dataPointsTemp
			}]
		});
		chart.render();

		// Chart with label + y2 values

		var chart = new CanvasJS.Chart("chartContainer2",
		{
			title:{
				text: "Chart with y2 value"
			},
			data: [
			{
				dataPoints: dataPointsHumidity
			}]
		});
		chart.render();

		// Chart with label + y and y2 values or multiSeries Chart

		var chart = new CanvasJS.Chart("multiChart",
		{
			title:{
				text: "Chart with y and y2 values"
			},
			data: [
			{
				type: "line",
				dataPoints: dataPointsTemp
			},
			{
				type: "line",
				dataPoints: dataPointsHumidity
			}
			]
		});
		chart.render();
	});
});
</script>
<style>
	.chart {
		display: inline-block;
	}
</style>
</head>
<body>
<div id="chartContainer1" class="chart" style="width: 50%; height: 300px;></div>
<div id="chartContainer2" class="chart" style="width: 45%; height: 300px;></div>
<div id="multiChart" style="width: 80%; height: 300px;margin:auto;></div>
</body>
</html>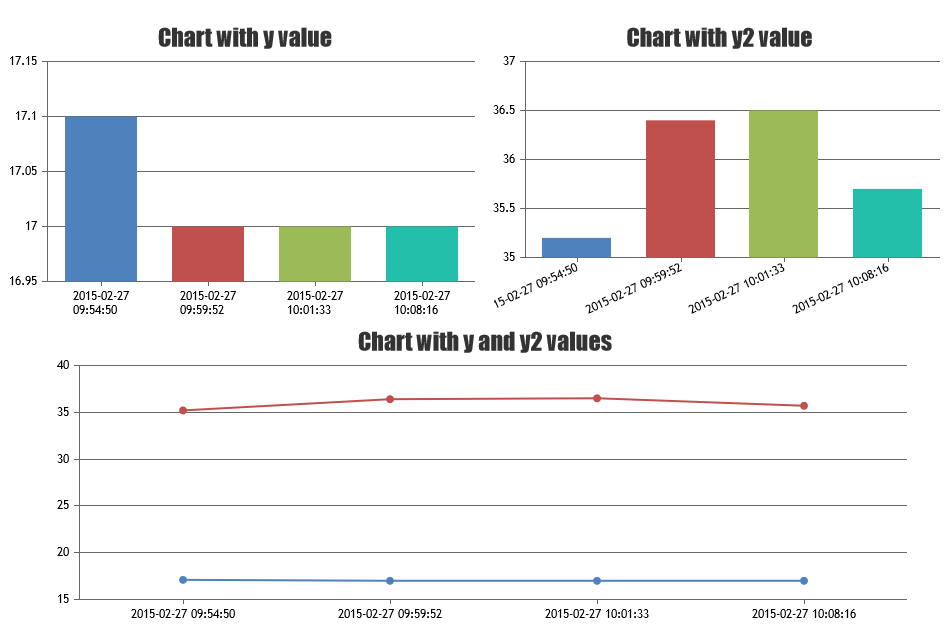
__
Anjali