Login to Ask a Question or Reply
Home › Forums › Chart Support › dynamic data points › Reply To: dynamic data points
June 2, 2014 at 9:27 pm
#6337
Here you have already passed the dataPoints value and hence the chart will be rendered with all the dataPoints.
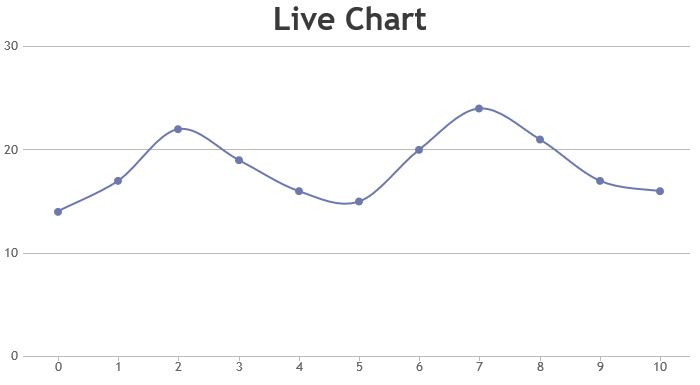
To create a dynamic chart, you will have to create and assign dataPoints to a pre-defined variable (Eg: dps). After which you will have to create a function which adds the next dataPoint and call chart.render(). Then you can call the function at regular intervals which adds the dataPoint and renders the chart.
Please take a look at the code snippet below,
var xVal = dps.length + 1;
var yVal = 100;
var updateInterval = 1000;

var updateChart = function () {


		yVal = yVal +  Math.round(5 + Math.random() *(-5-5));
		dps.push({x: xVal,y: yVal,});

		xVal++;

	chart.render();

};
setInterval(function(){updateChart()}, updateInterval);
Please take a look at this documentation page link for a step-by-step tutorial to create a dynamic chart that updates dataPoints at regular intervals.
