Login to Ask a Question or Reply
Home › Forums › Chart Support › Tooltip HTML › Reply To: Tooltip HTML
October 10, 2025 at 4:29 pm
#61521
CanvasJS tooltip is a HTML <div> element & lets you use any HTML content, such as <b>, <i>, <br>, <span>, <table>, <img>, and more, with the help of contentFormatter property. You can style these elements using inline CSS for formatting and layout control.
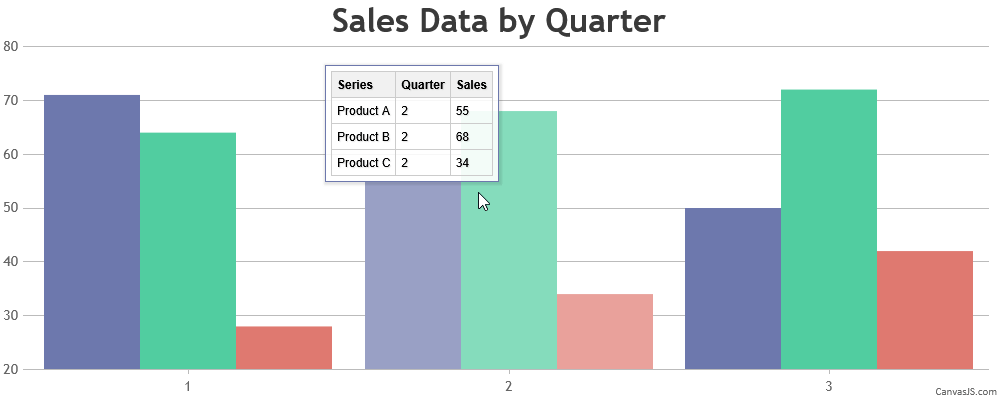
Are tables supported?
Yes, tables (<table>, <tr>, <td>) are fully supported. You can use contentFormatter to create a table dynamically, such as a three-column layout for series name, x-value, and y-value:
toolTip: {
  shared: true,
  contentFormatter: function(e) {
    var content = "<table style='border-collapse: collapse; font-family: Arial; font-size: 12px;'>";
    content += "<tr><th style='border: 1px solid #ccc; padding: 5px;'>Series</th>" +
               "<th style='border: 1px solid #ccc; padding: 5px;'>Quarter</th>" +
               "<th style='border: 1px solid #ccc; padding: 5px;'>Sales</th></tr>";
    for (var i = 0; i < e.entries.length; i++) {
      content += "<tr><td style='border: 1px solid #ccc; padding: 5px;'>" + e.entries[i].dataSeries.name + "</td>" +
                 "<td style='border: 1px solid #ccc; padding: 5px;'>" + e.entries[i].dataPoint.x + "</td>" +
                 "<td style='border: 1px solid #ccc; padding: 5px;'>" + e.entries[i].dataPoint.y + "</td></tr>";
    }
    content += "</table>";
    return content;
  }
}
Please refer to this Codepen for a working example of the same.
For more customization tips, see Customizing CanvasJS Chart Tooltips with Simple CSS Tweaks.
—
Vishwas R
Team CanvasJS