@junker1224,
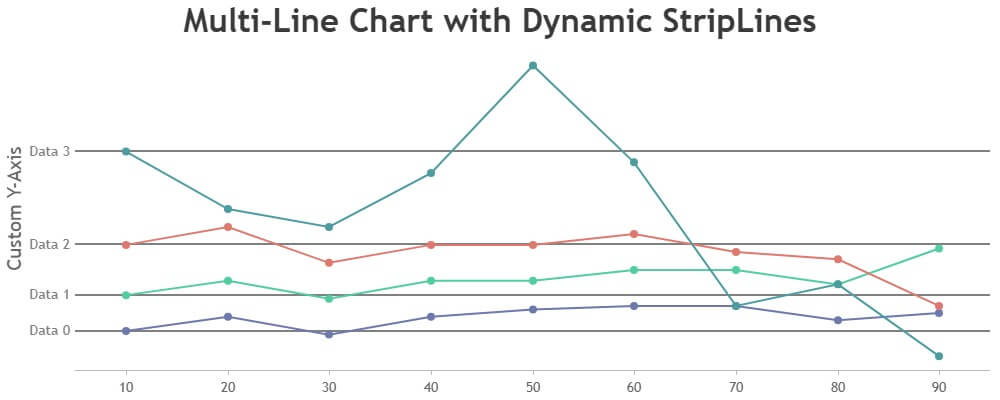
It’s not possible to have unequal intervals for axis labels. As a workaround, you can dynamically add striplines at the first Y-value of each series by iterating through chart.options.data. Please take look at this JSFiddle for an example of the same.
—
Ananya Deka
Team CanvasJS