Login to Ask a Question or Reply
Home › Forums › StockChart Support › How to render non-continuous time intervals separately in CanvasJS StockCharts? › Reply To: How to render non-continuous time intervals separately in CanvasJS StockCharts?
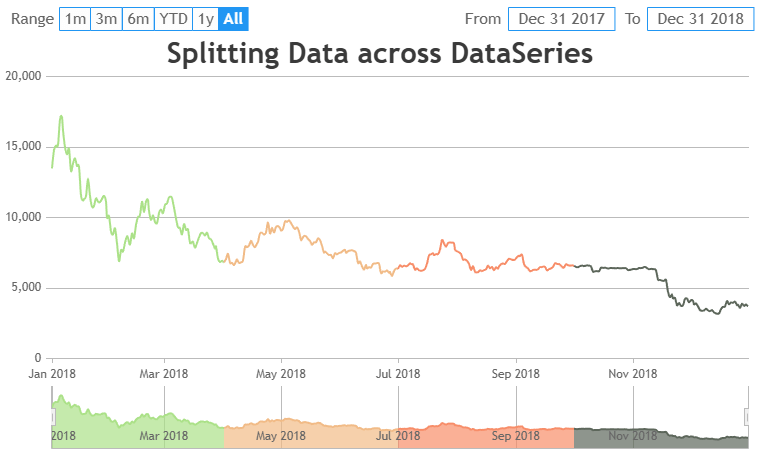
You can define interval groups and their associated styles (like color or lineDashType) in an object. Then, iterate through the dataPoints and assign each dataPoint to the appropriate dataSeries as per associated interval groups. Please take a look at this StackBlitz project for complete working code.
And also for each of those groups do we calculate the regression line separately?
You can use line chart to draw regression line. Please refer to this article for more information on performing regression analysis with CanvasJS.
—-
Manoj Mohan
Team CanvasJS