Login to Ask a Question or Reply
Home › Forums › Chart Support › PlotBands › Reply To: PlotBands
February 4, 2025 at 3:33 pm
#60530
James,
CanvasJS does support a feature similar to plotBands in Highcharts called stripLines. You can use stripLines in two ways:
- Single threshold (value): You can set a value for the stripLine to highlight a single threshold on the axis.
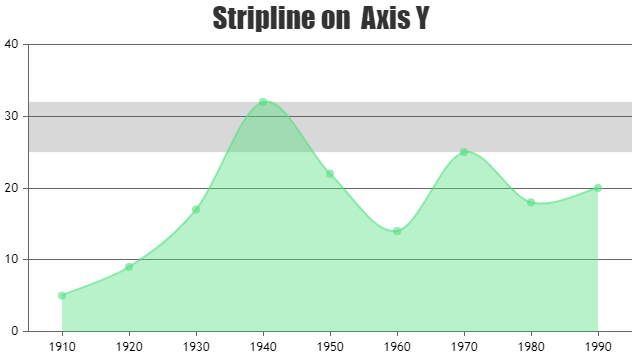
- Range (startValue and endValue): You can define both startValue and endValue to highlight a specific region, effectively creating a plotBand-like effect to emphasize a section of the chart between two axis values.
Please find the code-snippet for creating a stripLine (plotband) below:
axisY:{
  stripLines:[{
    startValue: 25,
    endValue: 32,
    color: "#d8d8d8"
  }]
}
—
Vishwas R
Team CanvasJS