Home › Forums › Feature Requests & Feedback › Histogram › Reply To: Histogram
@scompliance,
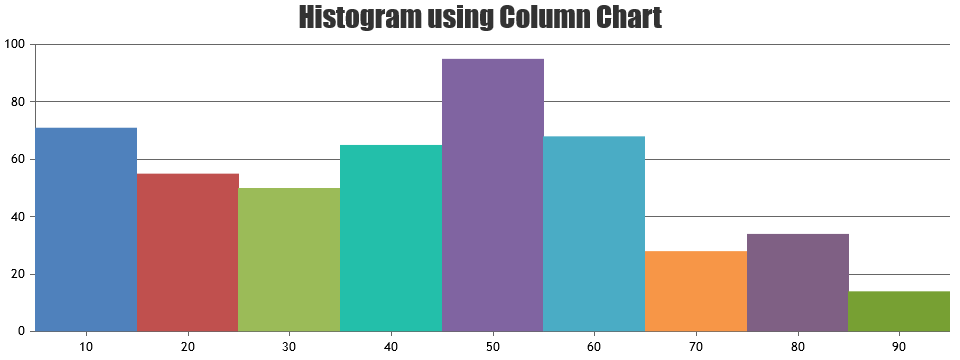
Histogram chart can be rendered by setting dataPointWidth based on axis width and the number of dataPoints in a column chart. Please check this JSFiddle for an example.
— Thangaraj Raman Team CanvasJS