@aunni,
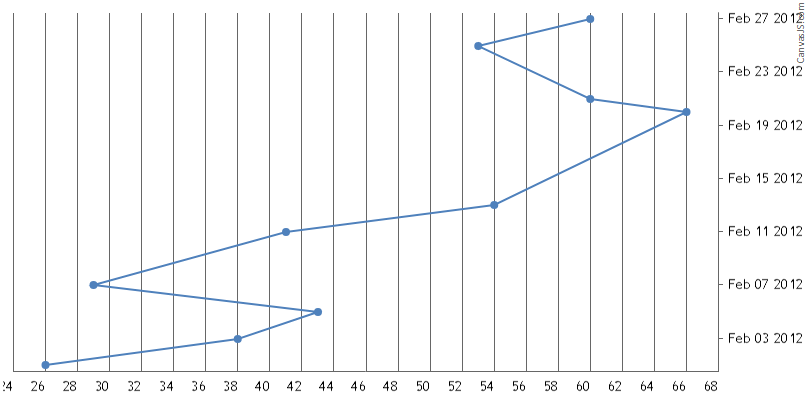
As of now, the tooltip is shown based on nearest x-values irrespective of y-values. In order to show tooltip based on y-values in a vertical line chart, you can create line chart and rotate it as shown in this JSFiddle.
—-
Manoj Mohan
Team CanvasJS