@arseneksa97,
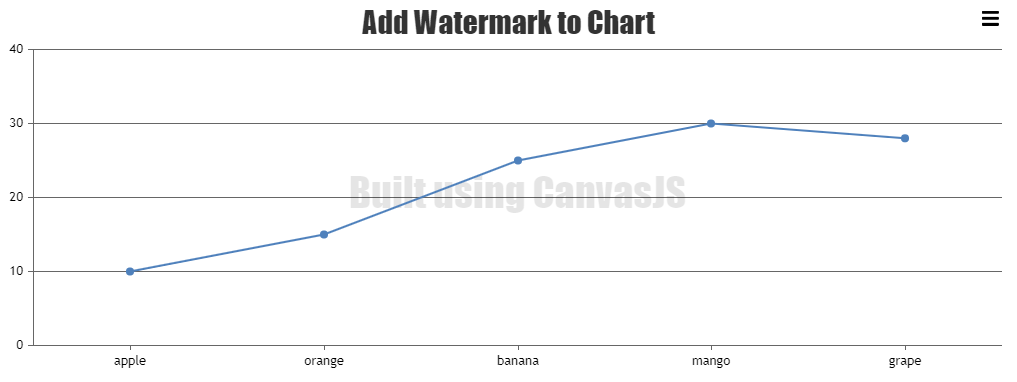
You can use subtitles to show a watermark in the plot area of the chart as shown in the code snippet below:
subtitles: [{
    text: "Built using CanvasJS",
    fontSize: 40,
    verticalAlign: "center",
    dockInsidePlotArea: true,
    fontColor: "rgba(0,0,0,0.1)"
}],
Please check this JSFiddle for a working example.
—
Thangaraj Raman
Team CanvasJS