@yo3dgjhcms-ro,
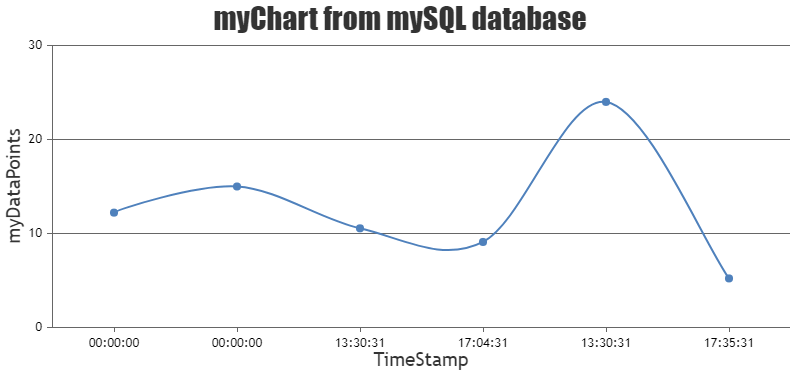
It seems like you are passing string as y-value. CanvasJS accepts number as y-value as of now. Passing it as number by parsing it should work fine in your case. Also, updating the url to fetch data from database (replace ajax/data.php with data.php) seems to be working fine.
dps.push({ "label":result[i].label, "y":parseFloat(result[i].y) });
Please take a look at this updated sample project for complete working code.

—-
Manoj Mohan
Team CanvasJS