@ezsolve,
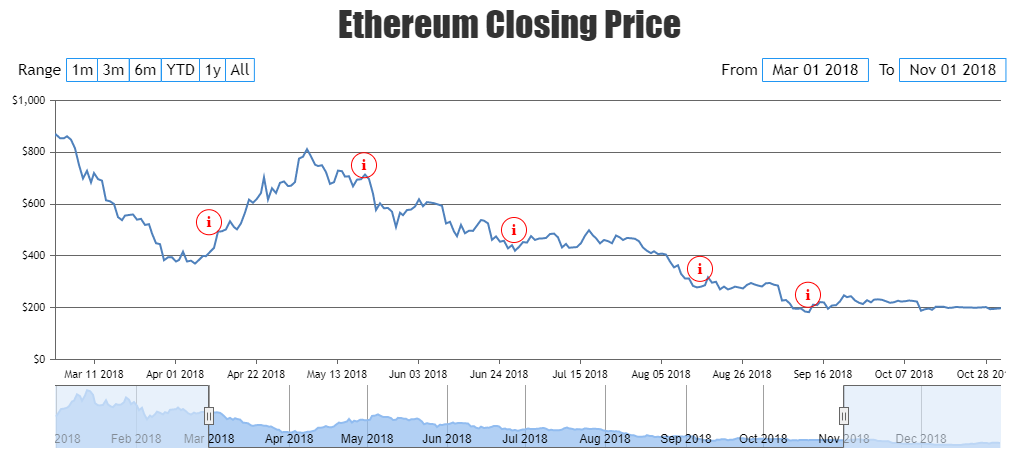
To render the equivalent of an info icon, you can add a scatter dataseries to the chart, and set an appropriate index label. The scatter points’ tooltip can be used to show any additional information as per your requirement.
Please check this JSFiddle for a working example.
—
Thangaraj Raman
Team CanvasJS