Login to Ask a Question or Reply
Home › Forums › Chart Support › Bar chart showing 1 and -1 value › Reply To: Bar chart showing 1 and -1 value
December 8, 2022 at 6:40 pm
#41372
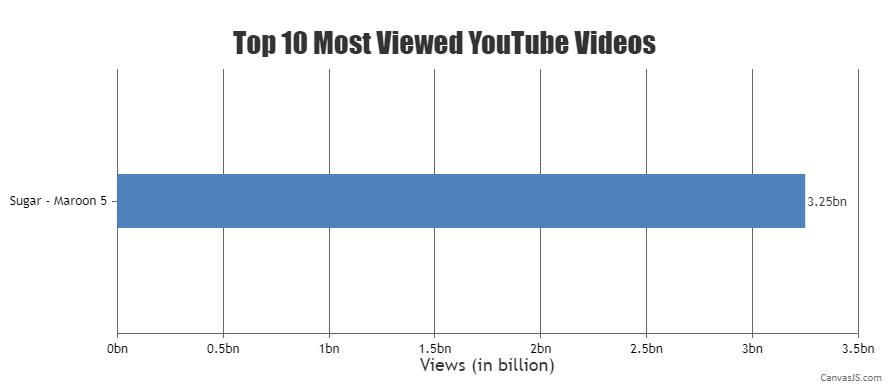
It looks like you are setting the axisX interval manually due to which the extra labels -1 and 1 are shown. Based on the interval & other factors, the axis range is calculated & hence the extra labels are added in this case. You can overcome this behavior by either not setting interval when there are fewer datapoints or by manually setting the axis range.
Please take a look at this JSFiddle for a working example.

—
Thangaraj Raman
Team CanvasJS