Login to Ask a Question or Reply
Home › Forums › Chart Support › No Axis no grid › Reply To: No Axis no grid
November 23, 2022 at 10:25 am
#40028
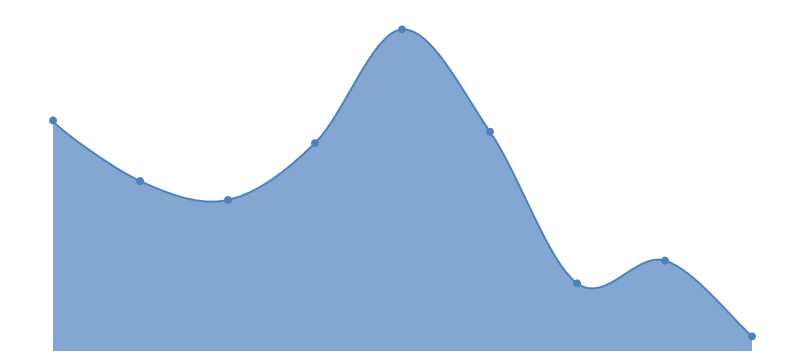
You can hide grids, ticks & axis lines by setting gridThickness, tickLength and lineThickness properties to 0. Please find the code-snippet below.
axisX:{
   gridThickness: 0,
   tickLength: 0,
   lineThickness: 0
},
axisY:{
   gridThickness: 0,
   tickLength: 0,
   lineThickness: 0
},
If you like to show axis labels inside the bar, you can do so by using labelPlacement property. Please take a look at this gallery page for an example on the same. However, if your requirement is to completely hide the axis labels & use indexlabels, you can use labelFormatter to do so. Below is the code snippet for the same.
axisX: {
    labelFormatter: function(e) {
        return "";
    }
}
Please take a look at this JSFiddle for an example on sparkline chart. Also, take a look at this Github repo for a plugin that ease your task.
—
Vishwas R
Team CanvasJS