@walterschaefer,
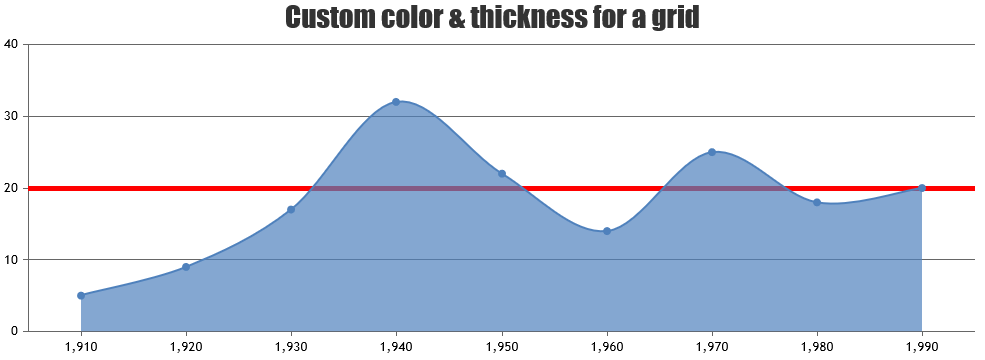
Gridlines are drawn at every interval of the axis. Color & thickness of all the grids can be changed using gridColor & gridThickness properties respectively. As addressed earlier, you can use stripline at a particular value to show different thickness & color of a grid. Please take a look at this JSFiddle for an example.
—
Vishwas R
Team CanvasJS