Login to Ask a Question or Reply
Home › Forums › Chart Support › toggle legend crash with axisX2 › Reply To: toggle legend crash with axisX2
September 2, 2022 at 6:25 pm
#39059
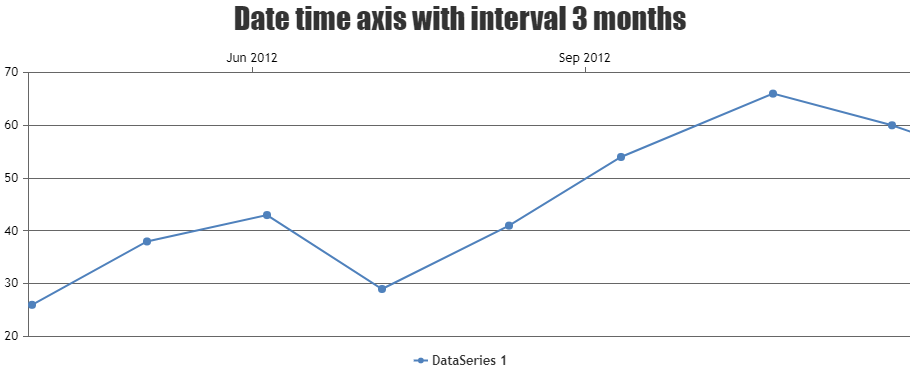
It seems like issue is happening when you are setting interval on datetime axis and none of the dataseries is visible. To overcome this issue, you can unset the interval when the dataseries is not visible and vice-vera when dataseries is visible as shown in the below code snippet.
itemclick: function (e) {
    if (typeof (e.dataSeries.visible) === "undefined" || e.dataSeries.visible) {
        e.chart.options.axisX2.interval = undefined;
        e.dataSeries.visible = false;
    } else {
        e.chart.options.axisX2.interval = 3;
        e.dataSeries.visible = true;
    }

    e.chart.render();
}
Also, check out this updated JSFiddle for complete working code.

—-
Manoj Mohan
Team CanvasJS