@harisul_ishbah,
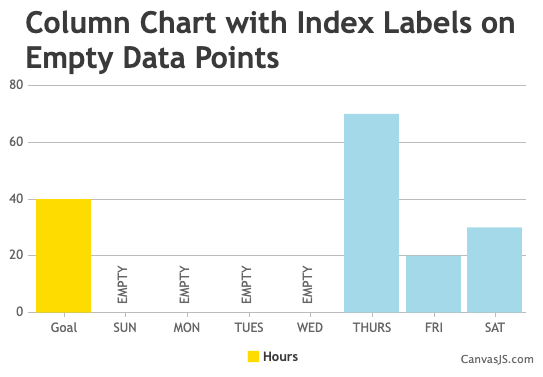
You can add custom strings like “EMPTY” on all the datapoints where y-values are 0 using indexLabel property on the datapoint level as shown in the code-snippet below,
for(var i = 0; i < chart.options.data[0].dataPoints.length; i++) {
  	if(chart.options.data[0].dataPoints[i].y === 0) {
    	 chart.options.data[0].dataPoints[i].indexLabel = "EMPTY"
}
Kindly take a look at this JSFiddle for an example on your requirement.
—
Adithya Menon
Team CanvasJS