Pavel Hulmak,
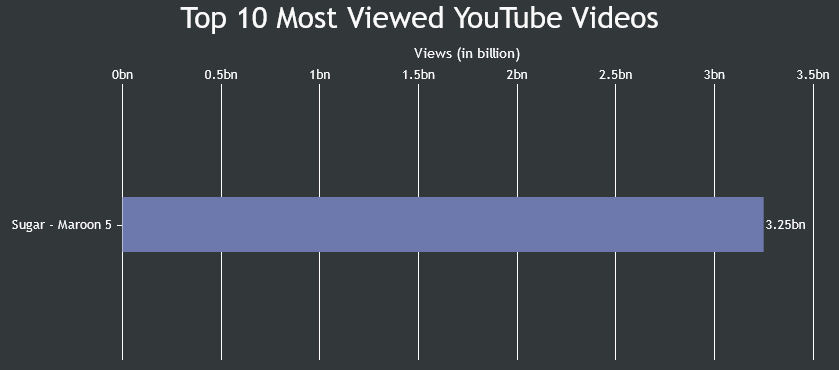
Extra labels +1 & -1 are shown as interval is set manually. Based on the interval & some other factors, axis range is calculated & hence the extra labels are added in this case. You can overcome this by either not setting interval when there are less datapoints or by manually setting axis range. Please take a look at this updated JSFiddle.

—
Vishwas R
Team CanvasJS