Home › Forums › Chart Support › Line graph with a cut line › Reply To: Line graph with a cut line
@swebs,
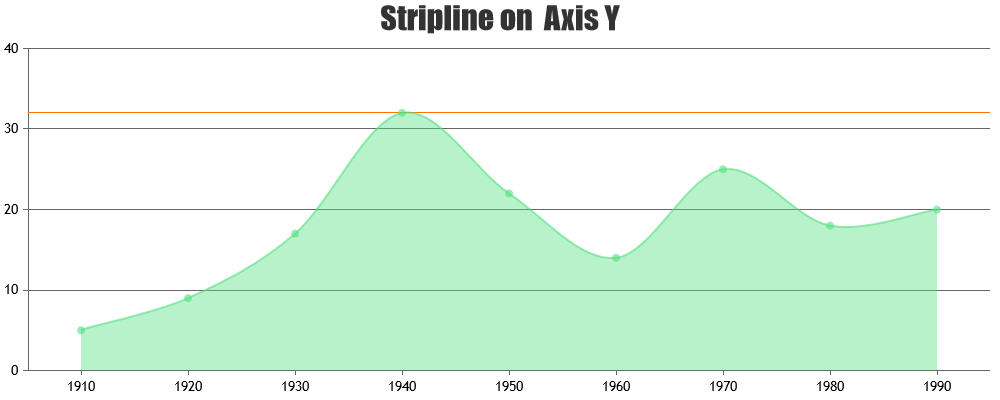
Y-axis Striplines can be used to show a horizontal line at any desired value. You can set value property to 250 in your case. Please find the code-snippet below.
axisY: {
    stripLines: [{
        value: 250
    }]
}
— Vishwas R Team CanvasJS