@friday096,
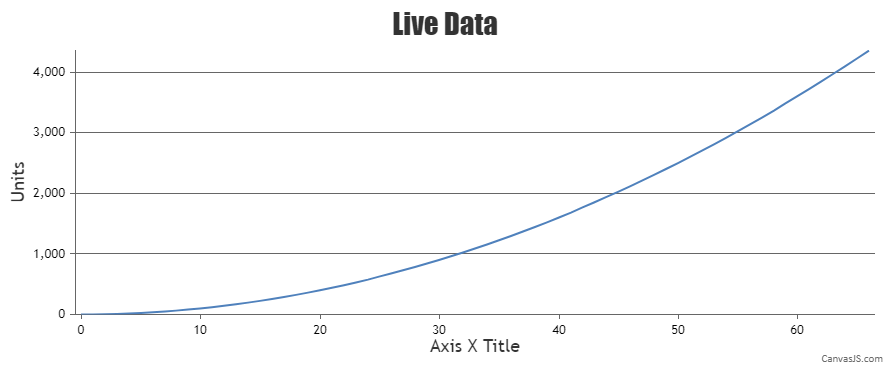
You can create similar graph that you are referring in the link shared above by creating a dynamic chart and by setting labelAutoFit to false as well as setting y-axis maximum. Please take a look at this StackBlitz project for an example on the same in React.
—-
Manoj Mohan
Team CanvasJS