Login to Ask a Question or Reply
Home › Forums › Chart Support › How to use laptimes in minutes, seconds, milliseconds › Reply To: How to use laptimes in minutes, seconds, milliseconds
April 18, 2022 at 7:02 pm
#37499
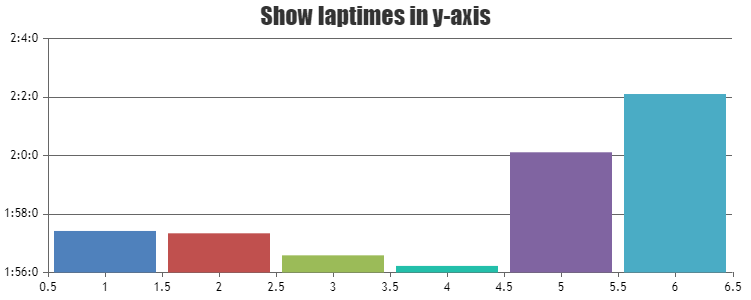
You can convert your laptime format string to milliseconds and pass it as y-values in the dataSeries. For axis labels, you format the milliseconds passed to your desired format (minutes:seconds:milliseconds) using labelFormatter & contentFormatter for tooltip. Please find the code-snippet below.
var dps = [
    { x: 1, y: "1:57:420" },
    { x: 2, y: "1:57:340" },
    { x: 3, y: "1:56:587" },
    { x: 4, y: "1:56:225" },
    { x: 5, y: "2:0:110" },
    { x: 6, y: "2:2:102" }
  ]

  dps.forEach(dp => {
    var splitString = dp.y.split(":");
    dp.y = parseInt(splitString[0]) * 60 * 1000 + parseInt(splitString[1]) * 1000 + parseInt(splitString[2]);
  })

  function formatMilliSeconds(val) {
    var minutes = parseInt(val / (60 * 1000));
    var seconds = parseInt(val % (60 * 1000) / 1000);
    var ms = parseInt(val % (60 * 1000) % 1000);
    return minutes + ":" + seconds + ":" + ms;
  }

  var chart = new CanvasJS.Chart("chartContainer", {
    .
    .
    .
    axisY: {
      labelFormatter: function(e) {
        return formatMilliSeconds(e.value)
      }
    },
    toolTip: {
    	contentFormatter: function(e) {
      	toolTipContent = "";
      	e.entries.forEach( (entry) => {
        	toolTipContent += "x -> " + entry.dataPoint.x + "<br/>y -> " + formatMilliSeconds(entry.dataPoint.y) + "<br/>"
        })
      	return toolTipContent;
      }
    },
    .
    .
    .
  });
Also, check out this JSFiddle for complete working code.
—-
Manoj Mohan
Team CanvasJS