@cancanvas,
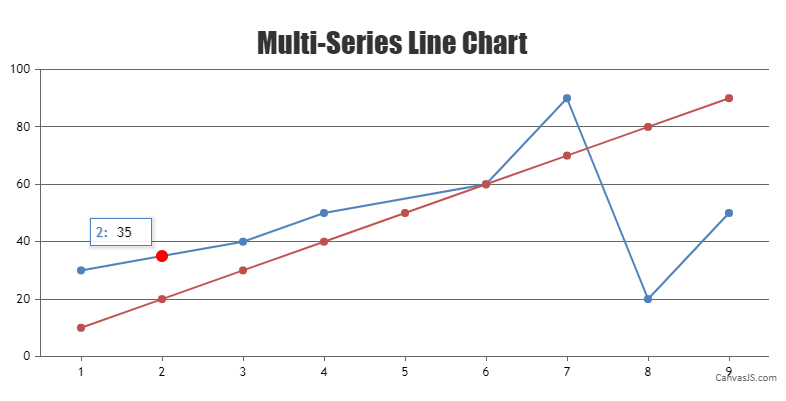
You can use the linear interpolation formula to find a point on a straight line. This interpolated value (y = y1 + ((x – x1) / (x2 – x1)) * (y2 – y1)) can be added to your dataSeries to display the toolTip.
Kindly take a look at this updated JSFiddle for an example on the same.

—
Adithya Menon
Team CanvasJS