Login to Ask a Question or Reply
Home › Forums › Chart Support › multiple sets of datapoints › Reply To: multiple sets of datapoints
January 31, 2022 at 10:43 pm
#36839
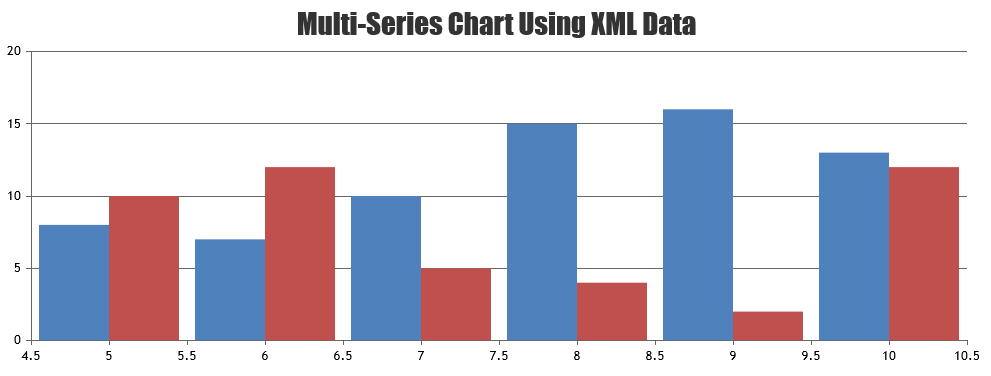
It is possible to create a multi-series chart with data from an XML file by looping through the XML data as shown in the code-snippet below,
$(data).find("point").each(function () {
    var $dataPoint = $(this);
    var x = $dataPoint.find("x").text();
    var y1 = $dataPoint.find("y1").text();
    var y2 = $dataPoint.find("y2").text();
    dps1.push({x: parseFloat(x), y: parseFloat(y1)});
    dps2.push({x: parseFloat(x), y: parseFloat(y2)});
  });
The format of the dataPoints in the XML file (e.g. data.xml) should be:
<point>
	<x>5</x>
	<y1>8</y1>
	<y2>10</y2>
</point>
Kindly take a look at this CodeSandbox for a working example.
—
Adithya Menon
Team CanvasJS