Login to Ask a Question or Reply
Home › Forums › Chart Support › Legend › Reply To: Legend
January 28, 2022 at 7:20 pm
#36800
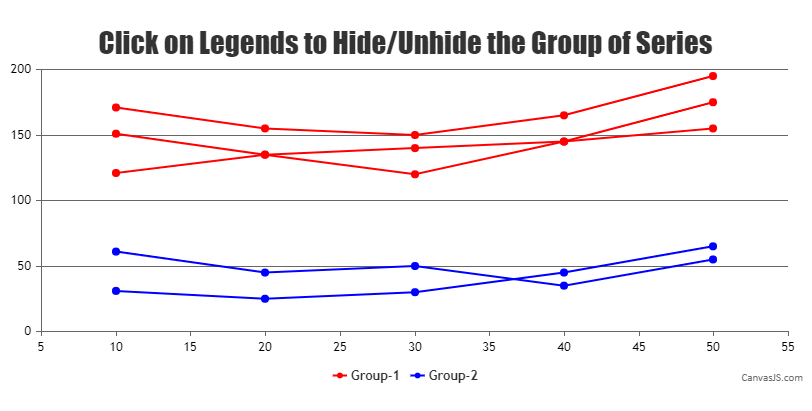
To display the legend for a group of data series, you can use the showInLegend property in any one of the data series in a group. You can also pass a custom property group to each data series and use this property to hide/unhide the data series using itemclick property of legend as shown in the code-snippet below,
function onLegendClick(e) {
  var groupSelected = e.dataSeries.group;
  for(var i = 0; i < e.chart.data.length; i++) {
    if(e.chart.options.data[i].group === groupSelected) {
      if (typeof (e.chart.options.data[i].visible) === "undefined" || e.chart.options.data[i].visible) {
        e.chart.options.data[i].visible = false;
      } else {
        e.chart.options.data[i].visible = true;
      }
    }
  }
}
Kindly take a look at this JSFiddle for an example with complete code.
—
Adithya Menon
Team CanvasJS