@maestrofc27,
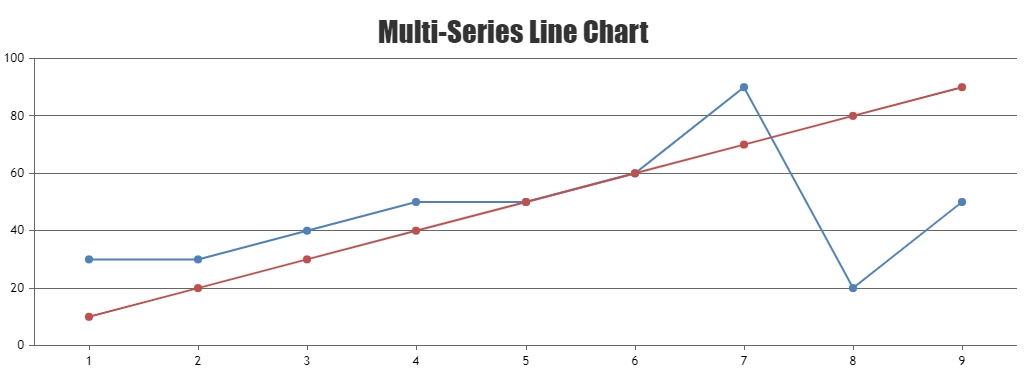
You can loop through datapoints and add the missing datapoint before rendering the chart. Please find the code-snippet below.
for(i=0; i<chart.options.data.length; i++) {
  var dps = chart.options.data[i].dataPoints;
  for(var j = 1; j < dps.length; j++) {
    if(dps[j].x > (j+1))
      dps.splice(j, 0, {x: j+1, y: dps[j-1].y});
  }
}
Please take a look at this JSFiddle for complete code.

—
Vishwas R
Team CanvasJS