Login to Ask a Question or Reply
Home › Forums › Chart Support › Axis-Y stripLines autoscale › Reply To: Axis-Y stripLines autoscale
January 21, 2022 at 6:29 pm
#36720
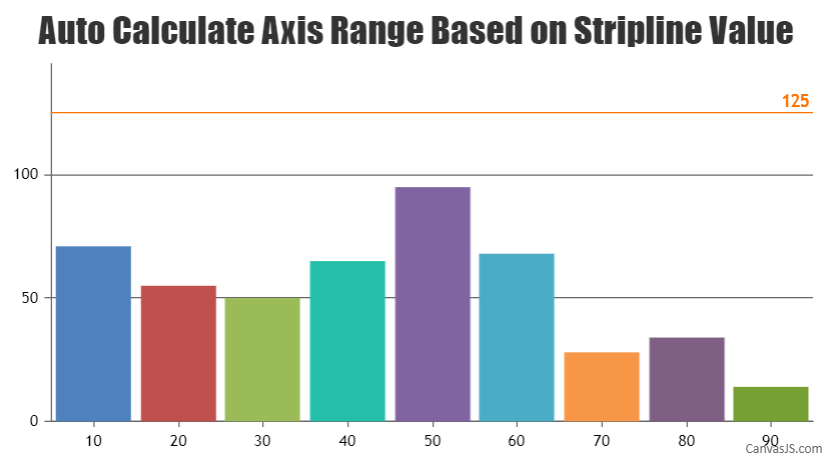
Axis range is calculated according to the datapoint values and not the striplines. So if the stripline value is more than that of the axis range, it won’t be shown in the plot-area. In this scenario, you can dynamically set the axis range to show stripline with the help of set method as shown below –
chart.axisY[0].set("maximum", chart.axisY[0].stripLines[0].get("value") + chart.axisY[0].get("interval"));
Kindly take a look at this JSFiddle for a working example with complete code.
___________
Indranil Singh Deo
Team CanvasJS