Login to Ask a Question or Reply
Home › Forums › Chart Support › Handle invalid values › Reply To: Handle invalid values
January 3, 2022 at 8:18 pm
#36620

@r-w,
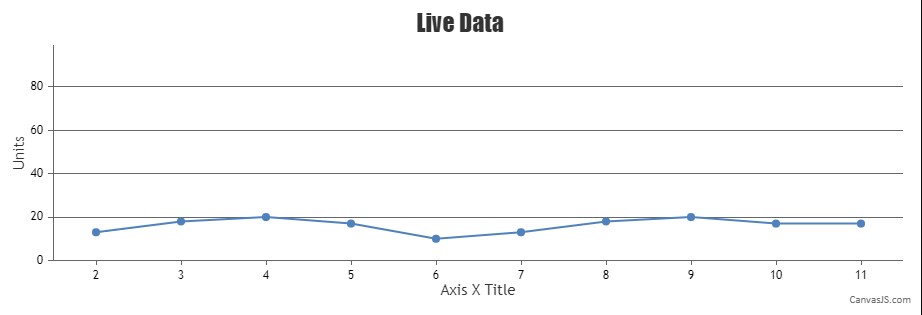
You can use viewportMinimum and viewportMaximum properties of axisY and set it to 0 and 99 respectively so that any value above 99 or below 0 are not visualized. Kindly take a look at this code-snippet for an example on your requirement,
axisY: {
  viewportMinimum: 0,
  viewportMaximum: 99
}
You can take a look at this JSFiddle for an example with complete code on the same.
If the solution suggested doesn’t fulfill your requirement, kindly brief us further about your use case with a pictorial representation or an example so that we can understand your scenario better and help you out with an appropriate solution.
—
Adithya Menon
Team CanvasJS