Login to Ask a Question or Reply
Home › Forums › Chart Support › Time in Axis Y and sync cross hair in multiple series › Reply To: Time in Axis Y and sync cross hair in multiple series
December 27, 2021 at 7:26 pm
#36585
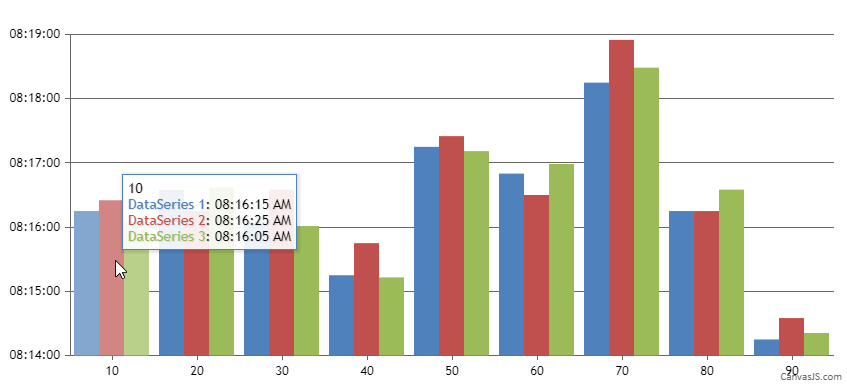
In order to display y values of all the dataSeries in a toolTip, you can loop through each of the e.entries and display the respective y values in appropriate format. Please check out the below code snippet.
contentFormatter: function (e) {
  var content = "";
  content += e.entries[0].dataPoint.x + "<br/>"
  for(var i=0; i<e.entries.length; i++) {
    content += "<span style= \"color:"+e.entries[i].dataSeries.color + "\">" + e.entries[i].dataSeries.name + "</span>: " + CanvasJS.formatDate(e.entries[i].dataPoint.y,"hh:mm:ss TT") + " <br/>";	//Formatting dateTime in ToolTip
  }
  return content;
}
Also, take a look at this JSFiddle for complete code.
—-
Manoj Mohan
Team CanvasJS