Login to Ask a Question or Reply
Home › Forums › StockChart Support › Setting option for every chart in multi-chart view › Reply To: Setting option for every chart in multi-chart view
December 23, 2021 at 7:39 pm
#36571
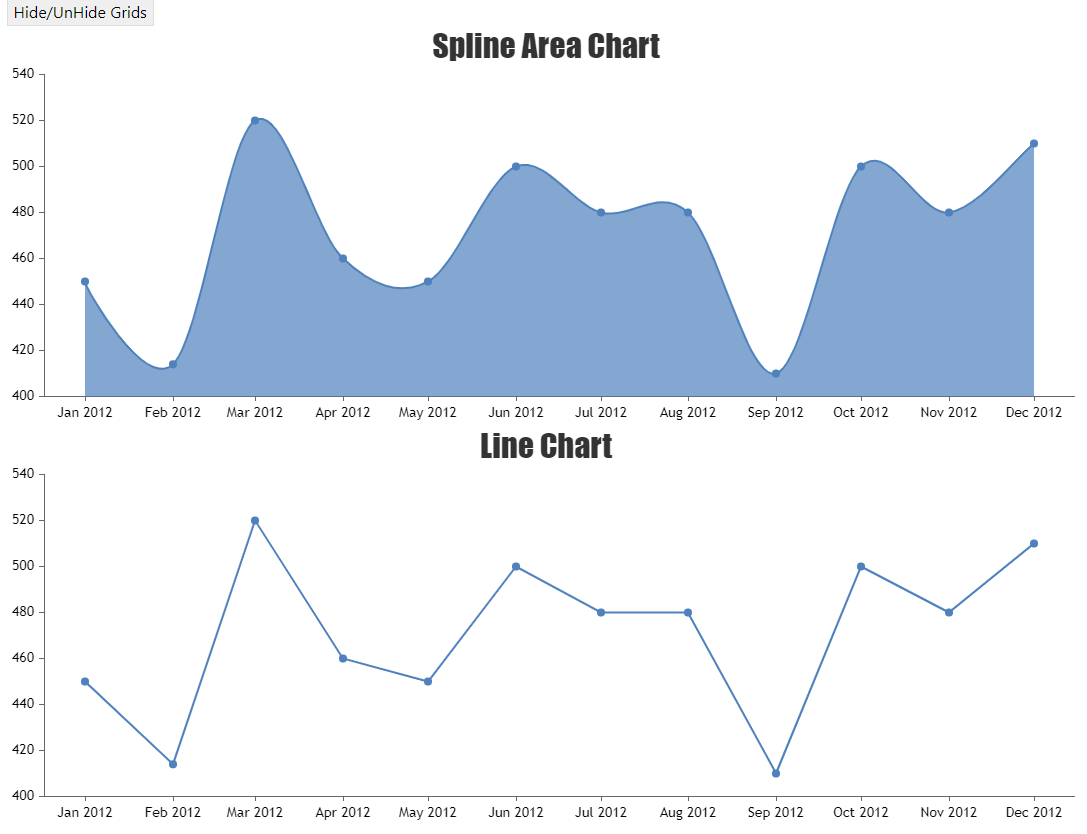
You can hide and unhide the axis gridlines by setting axis gridThickness to 0 and positive value respectively as shown in the below code snippet.
toggleGridLines() {
  for(var i = 0; i < this.charts.length; i++) {
  	for(var j = 0; j < this.charts[i].axisY.length; j++) {
    	this.charts[i].axisY[j].set("gridThickness", (this.charts[i].axisY[j].gridThickness ^ 1))
    }
  }
}
Also, check out this StackBlitz example for hide/unhide axis gridlines on click of a button.
—-
Manoj Mohan
Team CanvasJS