Login to Ask a Question or Reply
Home › Forums › Chart Support › Pleasseee help mee! My dream is to reach this! › Reply To: Pleasseee help mee! My dream is to reach this!
November 22, 2021 at 6:15 pm
#36330
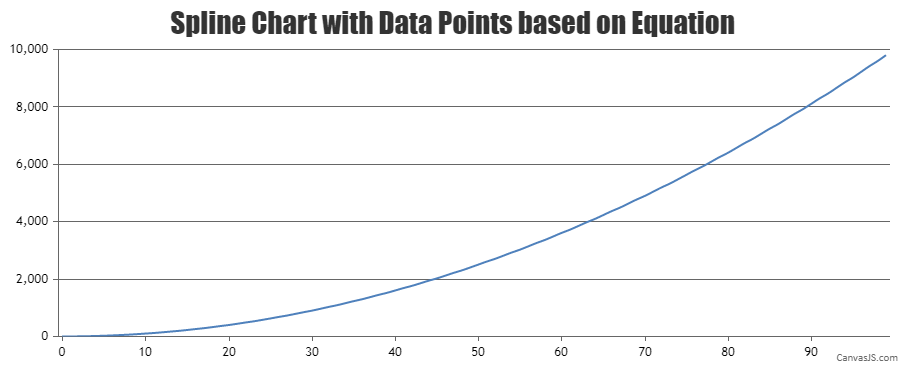
As of now, it is not possible to render a 3-dimensional Chart. However, you can have a function with x and y values and render the chart based on the calculated dataPoints along x and y-axis as shown below –
var chart = new CanvasJS.Chart("chartContainer",{
  zoomEnabled: true,
  title:{
    text: "Spline Chart with Data Points based on Equation"
  },
  data: [{
    type: "spline",
    dataPoints: dps
  }]
});
addDataPoints();
chart.render();

function addDataPoints() {
  for (var j = 0; j < dataLength; j++) {
    xVal = j;
    yVal = Math.pow(xVal,2) +  1;
    dps.push({
      x: xVal,
      y: yVal
    });
  }
}
Please take a look at this JSFiddle for a working example.
___________
Indranil Deo
Team CanvasJS