Login to Ask a Question or Reply
Home › Forums › Chart Support › Issue with logarithmic and value 0 › Reply To: Issue with logarithmic and value 0
October 7, 2021 at 6:21 pm
#35977
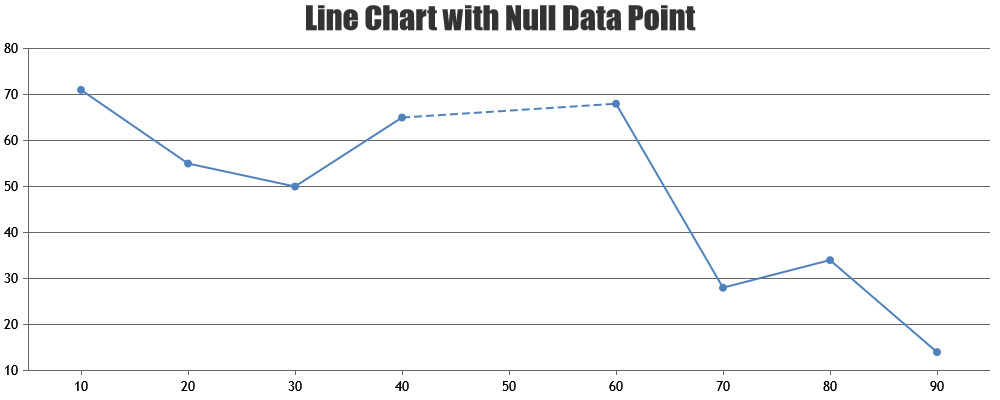
In case of line / spline chart, by default line will be broken when datapoint with null value is present. You can connect the non-null values directly by setting connectNullData property to true – which draws a dashed line to connect non-null datapoints. The type of this line can be changed by setting nullDataLineDashType property. Please refer to the code-snippet below.
...
data: [{
	...
	type: "line",
	connectNullData: true,
	nullDataLineDashType: "solid",
	...
}]
...
Please take a look at this updated JSFiddle for complete code.
—
Vishwas R
Team CanvasJS