Login to Ask a Question or Reply
Home › Forums › Chart Support › Issue with logarithmic and value 0 › Reply To: Issue with logarithmic and value 0
October 6, 2021 at 7:09 pm
#35952
As zero value is not supported in logarithmic axis, you can set the value to null by parsing through the datapoints before rendering. Please find the code-snippet below.
function parseZeroValue() {
var data = chart.options.data;
for(var i = 0; i < data.length; i++) {
for(var j =0; j < data[i].dataPoints.length; j++) {
var yValue = data[i].dataPoints[j].y;
if(yValue === 0) {
data[i].dataPoints[j].y = null; //Set this to some value like 0.01, if you like to show column
data[i].dataPoints[j].toolTipContent = ("{x}: " + yValue);
}
}
}
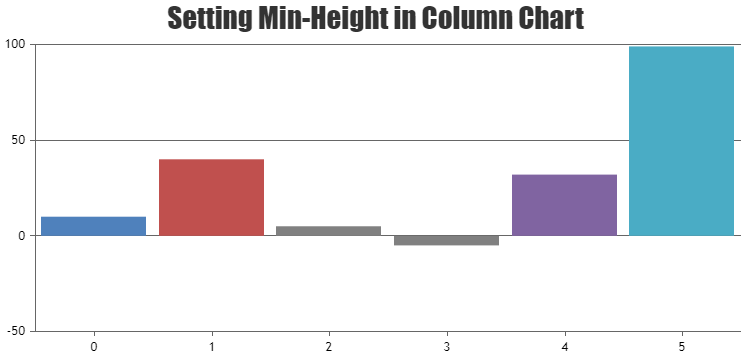
}Please take a look at this JSFiddle for complete code. Also refer to this JSFiddle which shows how to set minimum height in column chart.
—
Vishwas R
Team CanvasJS