@yashwanthgowda07,
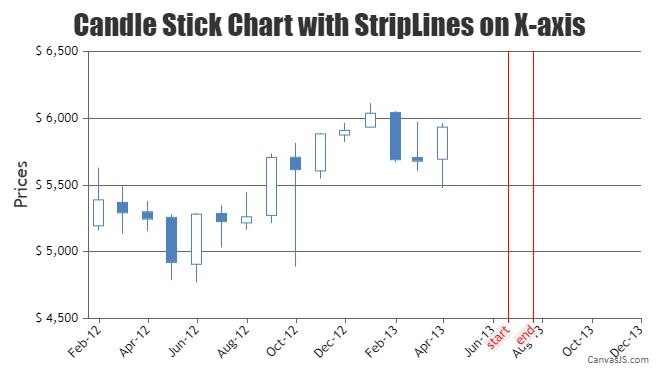
You can use stripLines on X-axis to draw a vertical line on a specific position on the chart to implement timings scale on the X-axis. To change the color of the strip lines, you can use the color property and you can use label property to set the labels for strip lines.

—
Adithya Menon
Team CanvasJS