Login to Ask a Question or Reply
Home › Forums › Chart Support › Style axisX & axisY font-color / font-size via CSS? › Reply To: Style axisX & axisY font-color / font-size via CSS?
July 30, 2021 at 2:40 am
#34980
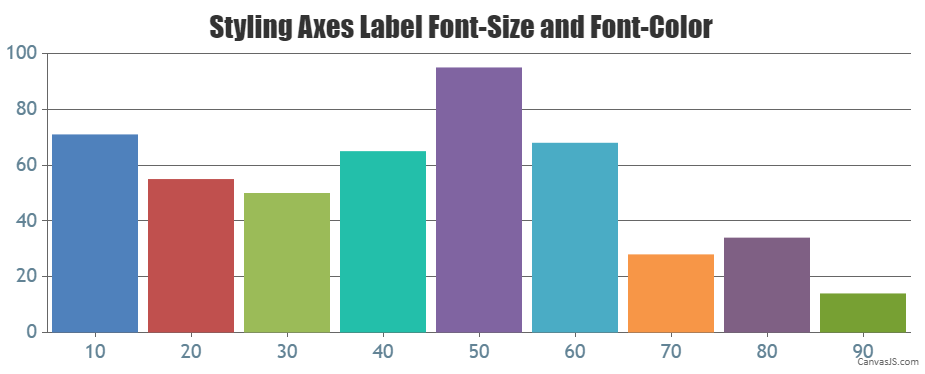
CanvasJS comes with in-build chart options to customize the chart elements. You can use the labelFontSize and labelFontColor properties to style the label font-size and font-color of both axes respectively as shown in the code snippet below –
axisX: {
  labelFontSize: 20,
  labelFontColor: "#628395"
},
axisY: {
  labelFontSize: 20,
  labelFontColor: "#628395"
},
Also, please take a look at this working JSFiddle for an example on customizing the axes label font-size and font-color.
___________
Indranil Deo
Team CanvasJS