@dunhamcd,
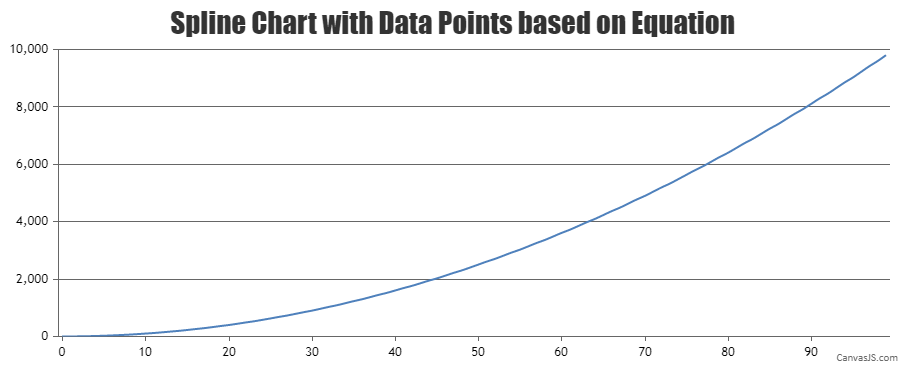
As of now, CanvasJS doesn’t have the option to add equations / technical indicators as an inbuilt feature. However, you can generate datapoints as per the equation & add a spline dataseries to the chart with few lines of code. Please take a look at this JSFiddle for an example on the same.
Also, you can check out this forum thread for more info on adding technical indicators (SMA & EMA).
—-
Manoj Mohan
Team CanvasJS