Login to Ask a Question or Reply
Home › Forums › StockChart Support › candlestick with minutes,day and month and zoom › Reply To: candlestick with minutes,day and month and zoom
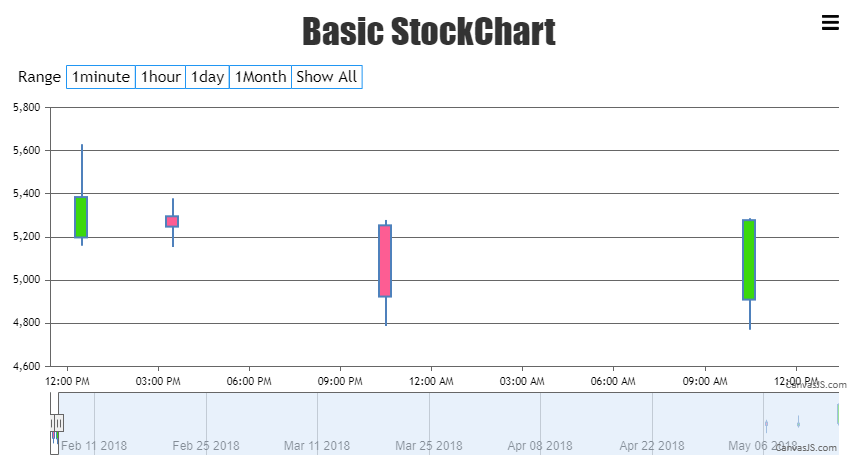
Y-Values in candlestick chart is an array of 4 values, but in your code you seem to be passing just one y-value, providing an array of 4 values will work in your case.
Also, the x-axis label format seems to be working fine. The label format is updating to minute, day, month based on the range of the zoomed region. Please take a look at this updated JSFiddle.
If you are still facing the issue, kindly create JSFiddle reproducing the issue you are facing and share it with us along with sample data so that we can look into the code, understand the scenario better and help you out.
___________
Indranil Deo
Team CanvasJS