Login to Ask a Question or Reply
Home › Forums › Chart Support › Scatter Plot Area › Reply To: Scatter Plot Area
May 11, 2021 at 6:16 pm
#34295
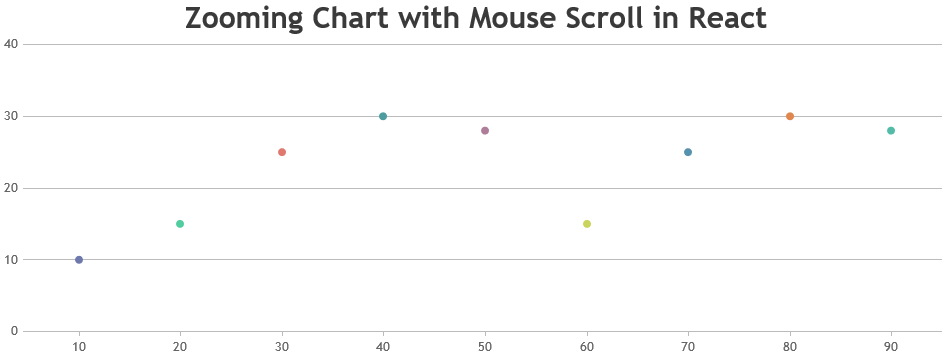
You can use react onWheel event to zoom into the chart by updating the viewportMinimum and viewportMaximum properties as shown below –
wheelHandler = (e) => {
  e.preventDefault();
  if(e.clientX < chart.plotArea.x1 || e.clientX > chart.plotArea.x2 || e.clientY < chart.plotArea.y1 || e.clientY > chart.plotArea.y2)
    return;

  var axisX = chart.axisX[0];
  var viewportMin = axisX.get("viewportMinimum"),
      viewportMax = axisX.get("viewportMaximum"),
      interval = axisX.get("minimum");

  var newViewportMin, newViewportMax;

  if (e.deltaY < 0) {
    newViewportMin = viewportMin + interval;
    newViewportMax = viewportMax - interval;
  }
  else if (e.deltaY > 0) {
    newViewportMin = viewportMin - interval;
    newViewportMax = viewportMax + interval;
  }

  if(newViewportMin < chart.axisX[0].get("minimum"))
    newViewportMin = chart.axisX[0].get("minimum");

  if(newViewportMax > chart.axisX[0].get("maximum"))
    newViewportMax = chart.axisX[0].get("maximum");

  if((newViewportMax - newViewportMin) > (2 * interval)){
    dataPointCounter = 0;
    for ( var i = 0; i < chart.options.data[0].dataPoints.length; i++ ){
      if(chart.options.data[0].dataPoints[i].x > newViewportMin && chart.options.data[0].dataPoints[i].x < newViewportMax){
        dataPointCounter++;
      }
    }
    if(dataPointCounter > 2){
      chart.axisX[0].set("viewportMinimum", newViewportMin, false);
      chart.axisX[0].set("viewportMaximum", newViewportMax);
    }
  }
};
Please take a look at this StackBlitz for an example.
___________
Indranil Deo
Team CanvasJS