Login to Ask a Question or Reply
Home › Forums › Chart Support › Line Chart Series Overlapping › Reply To: Line Chart Series Overlapping
What you observe on the chart:
1) The color of the data point is red which is series 1.
2) The color of the line is blue which is series 2.I need to understand why is that so, and how do we make datapoint also have color blue which is of series 2?
In the JSFiddle you have shared, you are using lineColor which changes the color of line not the marker(dataPoint). To change the marker color as well, you can set the markerColor. In your case, you can use color property to set the color of both line and marker. Whenever there are multiple series overlapping each other, the last series will be shown and on hovering the marker will be shown for first dataSeries.
Also what I want to achieve is:
1) When i hover over the data point, since it is series 1 how do we make other series (in our example series 2) with less opacity and series 1 with more opacity.
2) The example has only 2 series, but we can have multiple series and only the highlighted series should have a greater opacity as compared to others.
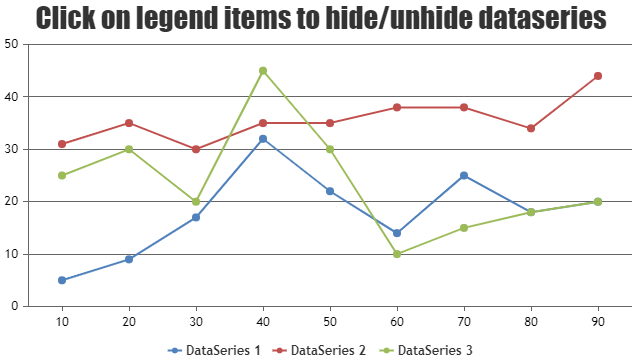
I suggest you to use legend to hide and unhide the dataSeries whenever there are series overlapping each other.
—-
Manoj Mohan
Team CanvasJS