@shravya,
In dataPoints, the x value can either be numeric or DateTime object. If you want to show a string as the X-axis label, you can use the label property.
Kindly take a look at this code-snippet for an example,
data: [{
type: "column",
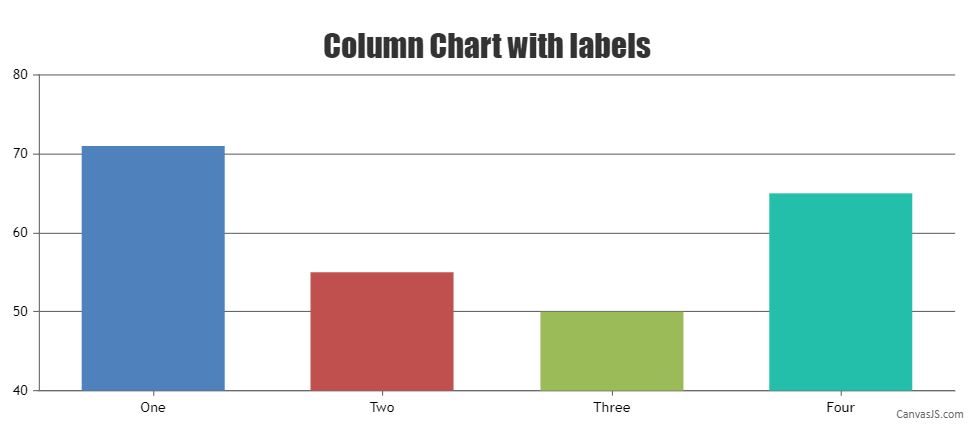
dataPoints: [
{ label: "One", y: 71 },
{ label: "Two", y: 55 },
{ label: "Three", y: 50 },
{ label: "Four", y: 65 },
]
}]
Also, take a look at this JSFiddle for an example on column chart with labels.